


Section 7 Refrigeration System
Part No. 80-1214-3 7-11
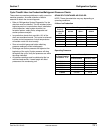
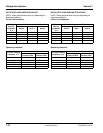
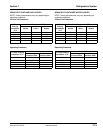
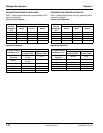
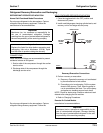
Cycle Time/24 Hour Ice Production/Refrigerant Pressure Charts
These charts are used as guidelines to verify correct ice
machine operation. Accurate collection of data is
essential to obtain the correct diagnosis.
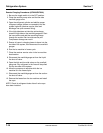
• Refer to “Refrigeration System Diagnostics” for the
data that must be collected. This list includes: before
beginning service, ice production check, installation/
visual inspection, water system checklist, ice
formation pattern, safety limits, safeguards and
suction pressure analysis.
• Ice production checks that are within 10% of the
chart are considered normal. This is due to variances
in water and air temperature. Actual temperatures
will seldom match the chart exactly.
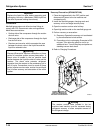
• Zero out manifold gauge set before obtaining
pressure readings to avoid misdiagnosis.
• Discharge and suction pressure are highest at the
beginning of the cycle. Suction pressure will drop
throughout the cycle. Verify the pressures are within
the range indicated.
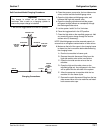
• All pressure readings must be obtained at the ice
machine head section. Lineset length will affect
pressures at the condensing unit.
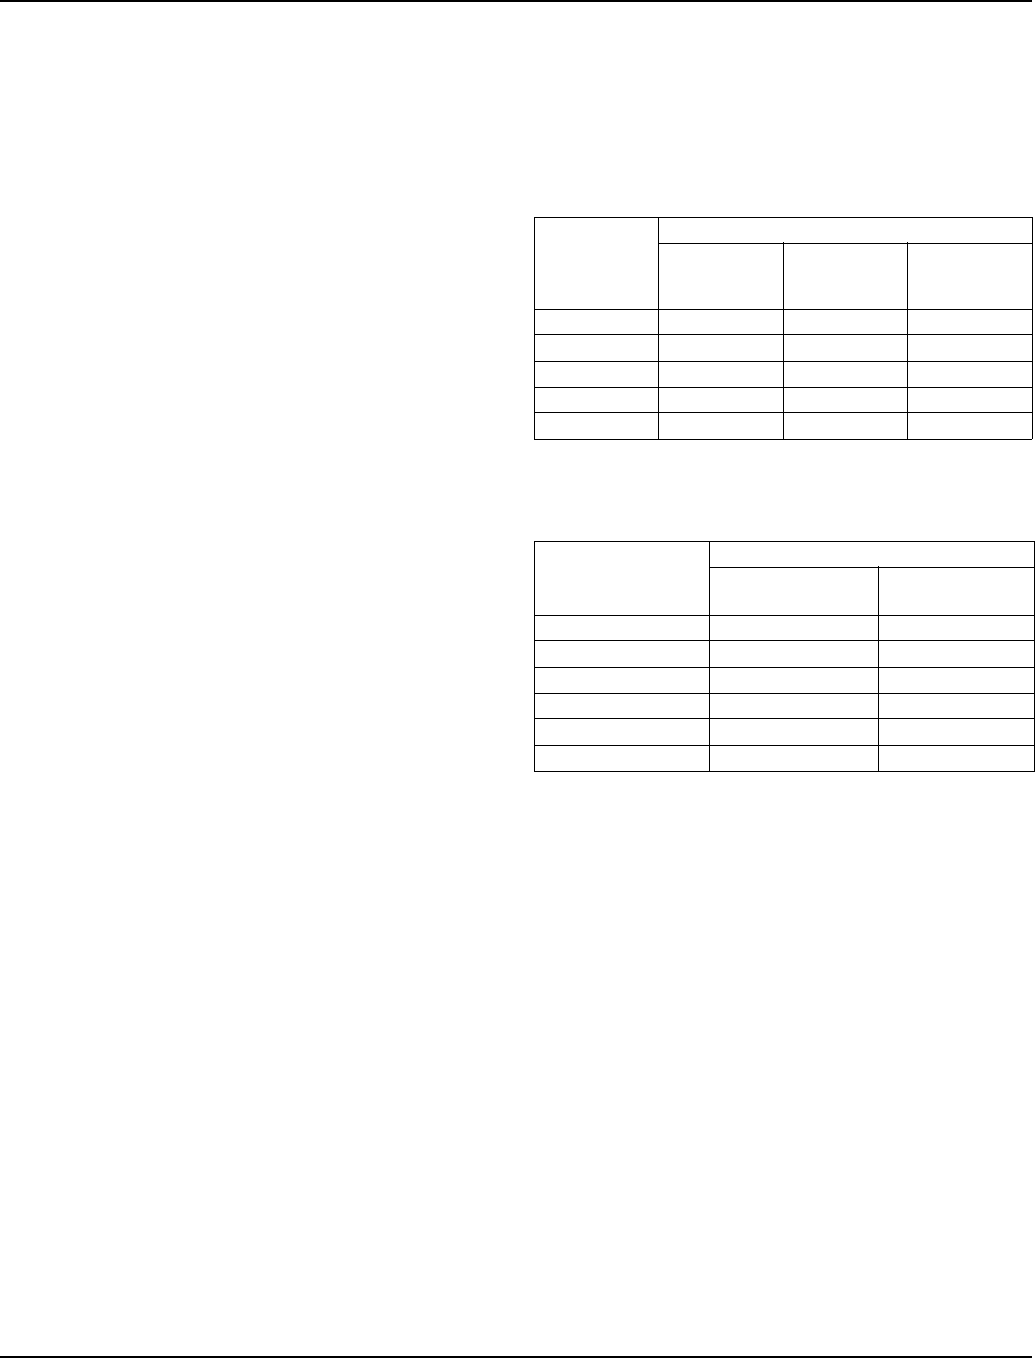
QF400 SELF-CONTAINED AIR COOLED
NOTE: These characteristics may vary depending on
operating conditions.
24 Hour Ice Production
Operating Pressures
Air Temp.
Entering
Condenser
°F/°C
Water Temperature °F/°C
50/10.0 70/21.1 90/32.2
70/ 21.1 395 360 335
80/26.7 375 320 300
90/32.2 335 300 270
100/37.8 295 250 240
110/43.3 255 230 225
Air Temp. Entering
Condenser °F/°C
Freeze Cycle
Discharge
Pressure PSIG
Suction
Pressure PSIG
50/10.0
160-180 27-29
70/21.1 210-235 32-35
80/26.7 250-295 34-39
90/32.2 285-315 37-41
100/37.8 320-360 40-46
110/43.3 370-405 44-49
Revised 8/2003