44 Managing fabrics
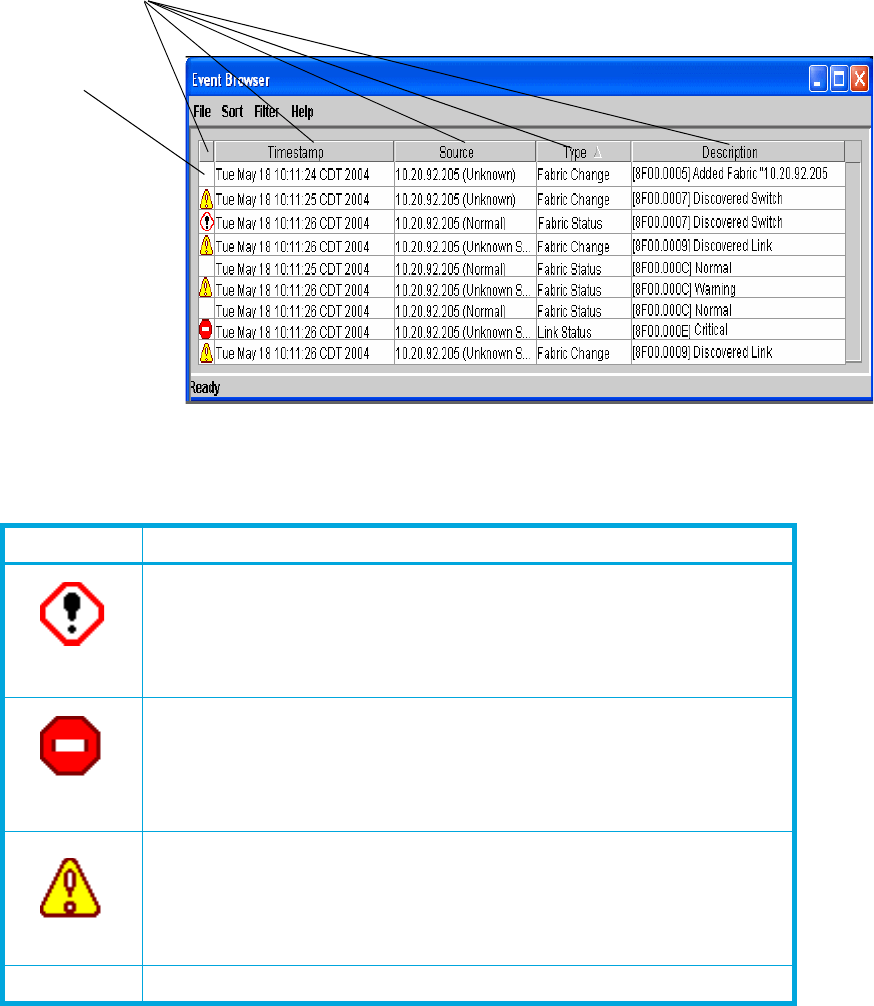
Entries in the Event Browser shown in Figure 21 are formatted by severity, time stamp, source, type, and
description. The maximum number of entries allowed in the Event Browser is 10,000. The maximum
number of entries allowed on a switch is 1200. Once the maximum is reached, the event list wraps and
the oldest events are discarded and replaced with the new events. Event entries from the switch, use the
switch time stamp, while event entries generated by the application have a workstation time stamp. You
can filter, sort, and export the contents of the Event Browser to a file. The Event Browser begins recording
when enabled and switch management application is running.
Figure 21 Event Browser
Severity is indicated in the severity column using icons as described in Table 5.
Table 5 Severity levels
Severity icon Description
Alarm — an alarm is a "serviceable event". This means that attention by
the user or field service is required. Alarms are posted asynchronously to
the screen and cannot be turned off. If the alarm denotes that a system
error has occurred the customer and/or field representative will generally
be directed to provide a "show support" capture of the switch.
Critical event — an event that indicates a potential failure. Critical log
messages are events that warrant notice by the user. By default, these log
messages will be posted to the screen. Critical log messages do not have
alarm status as they require no immediate attention from a user or service
representative.
Warning event — an event that indicates errors or other conditions that
may require attention to maintain maximum performance. Warning
messages will not be posted to the screen unless the log is configured to
do so. Warning messages are not disruptive and, therefore, do not meet
the criteria of Critical. The user need not be informed asynchronously
No icon Informative — an unclassified event that provides supporting information
Column sorting
buttons
Severity
column