


Encore Software for the OMB-NET6000 Series
8
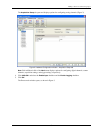
2. From the Signal Explorer, drag the Measurement group (Voltage in this example) onto the graph in the
Data View.
3. Click Play.
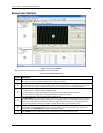
Data playback begins. The timeline marker shows the playback progress. Select View»Playback Options
to change playback settings, such as the start and stop time or block size.
Performing computations on logged data
You can perform computations on data in either the Measurement Work Area or Playback Work Area. The
following procedure shows you how to compute the power spectrum:
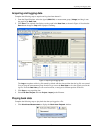
1. Right-click on the channel group in the Signal Explorer and select Compute»Power Spectrum.
A Computations folder containing a Power Spectrum entry is added to the Signal Explorer.
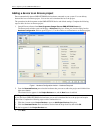
2. Drag Power Spectrum from the Signal Explorer to the Data View.
A Frequency Graph is automatically added to the Data View. The Data View automatically splits to show
both the time domain and the frequency domain data simultaneously.
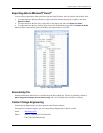
Figure 6. Calculating the Power Spectrum
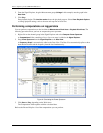
3. Click Start or Play, depending on the Work Area.
The Computations folder updates with the calculated data.
Refer to the Encore Help for a list of the computations you can perform.