13
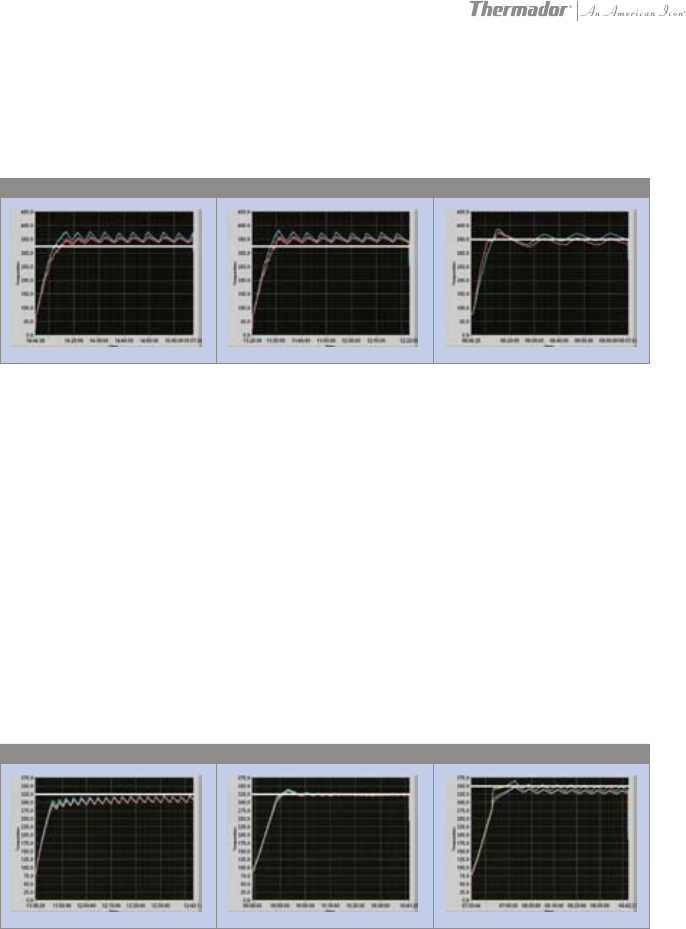
True Convection at 325ºF Convection Bake at 325ºF Bake at 350ºF
True Convection at 325ºF Convection Bake at 325ºF Bake at 350ºF
TEMPERATURE GRAPHS – VIKING
TEMPERATURE GRAPHS – DACOR
CYCLES TEMPERATURE ABOVE
SET LEVEL
BETTER PERFORMANCE THAN WOLF AND
VIKING, BUT STILL BELOW THERMADOR
• Viking wall ovens also use a basic 2-point algorithm to control the oven temperature.
• For the same reasons as the Wolf wall ovens, the Viking shows a typical swing of the
temperature in the effort to keep the set temperature level.
• The temperature graphs in True Convection and Convection Bake show a complete lack
of keeping the set temperature. The Viking oven stays above the set temperature for a
minimum of 15°F and a maximum of 50°F the entire time.
• Failed baking tests are just a logical result of this temperature performance.
• Also, the Dacor wall ovens use a basic 2-point algorithm to control the
oven temperature.
• The True Convection and Bake graphs show the typical temperature swing.
• In True Convection, the Dacor oven does not reach the set temperature.
It undershoots the set temperature by 5° to 30°F.
• In Convection Bake, the oven regulates the temperature on the set level.


