


Refrigeration System Section 7
7-20
Part Number 80-1632-3
Cycle Time/24 Hour Ice Production/
Refrigerant Pressure Charts
These charts are used as guidelines to verify correct ice
machine operation.
Accurate collection of data is essential to obtain the
correct diagnosis.
• Refer to “OPERATIONAL ANALYSIS TABLE” for the
list of data that must be collected for refrigeration
diagnostics. This list includes: before beginning
service, ice production check, installation/visual
inspection, water system checklist, ice formation
pattern, safety limits, comparing evaporator inlet/
outlet temperatures, discharge and suction pressure
analysis.
• Ice production checks that are within 10% of the
chart are considered normal. This is due to variances
in water and air temperature. Actual temperatures
will seldom match the chart exactly.
• Zero out manifold gauge set before obtaining
pressure readings to avoid misdiagnosis.
• Discharge and suction pressure are highest at the
beginning of the cycle. Suction pressure will drop
throughout the cycle. Verify the pressures are within
the range indicated.
• Record beginning of freeze cycle suction pressure
one minute after water pump energizes.
• Regular cube production derate is 7%
• 50Hz production derate is 7%
• 50Hz regular cube total production derate is 14%
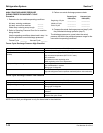
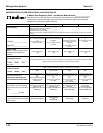
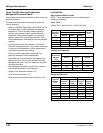
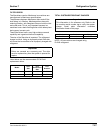
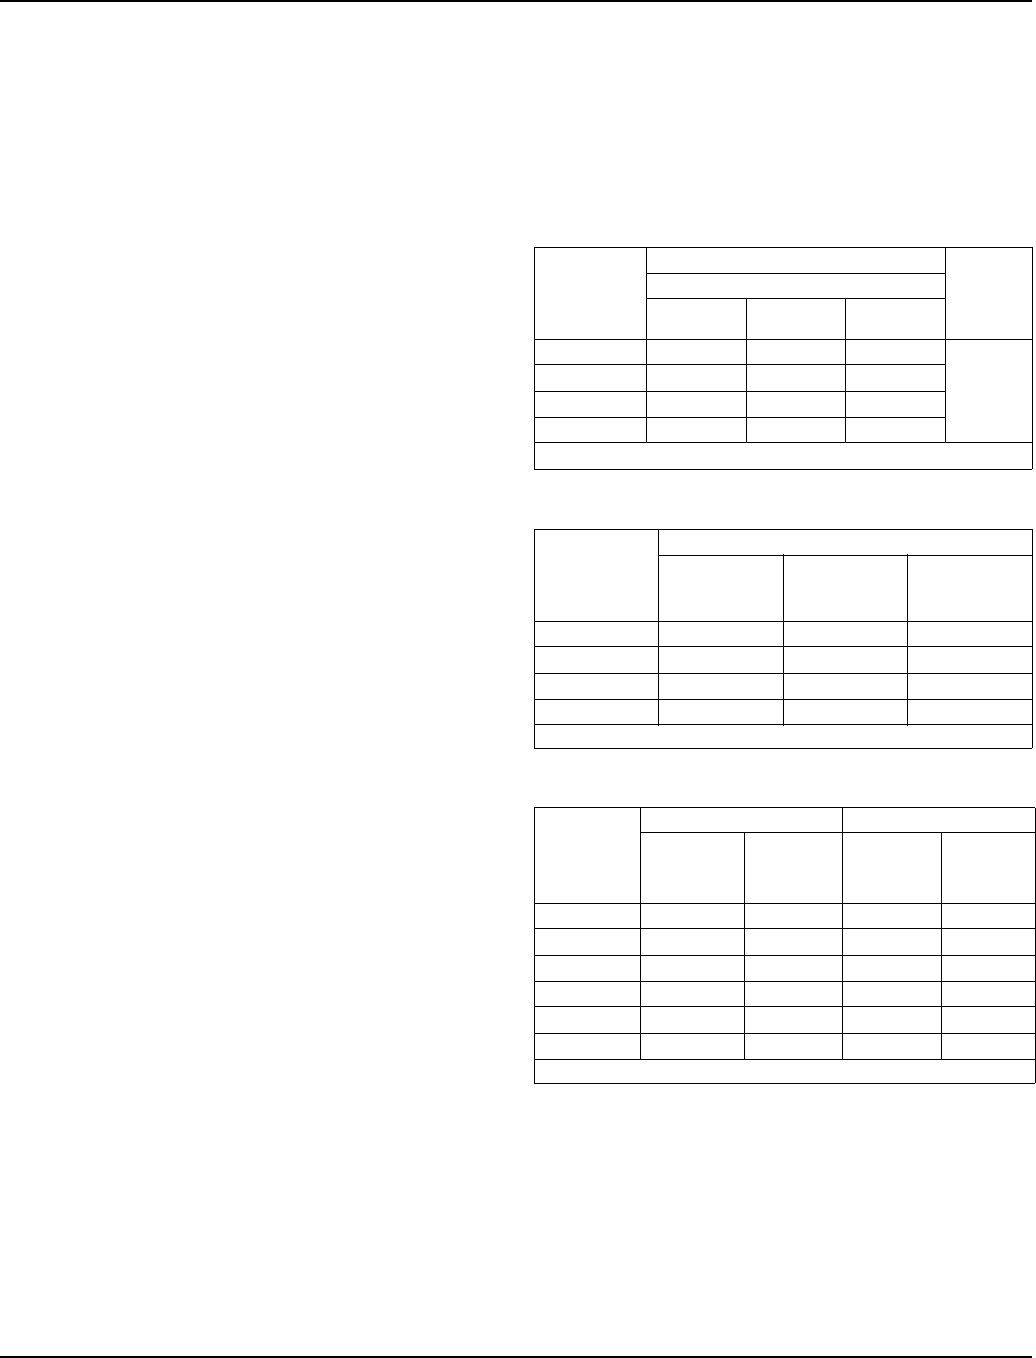
S1400 SERIES
Self-Contained Water-Cooled
NOTE: These characteristics may vary depending on
operating conditions.
Cycle Times
Freeze Time + Harvest Time = Total Cycle Time
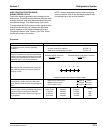
24 Hour Ice Production
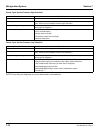
Operating Pressures
Air Temp.
Around Ice
Machine
°F/°C
Freeze Time
Harvest
Time
Water Temperature °F/°C
50/10.0 70/21.1 90/32.2
70/21.1 8.9-10.0 9.8-10.9 11.2-12.5
1-2.5
80/26.7 8.9-10.0 9.8-10.9 11.4-12.6
90/32.2 8.9-10.0 9.6-10.7 11.6-12.9
100/37.8 9.0-10.1 10.0-11.2 11.7-13.0
Times in minutes
Air Temp.
Around Ice
Machine
°F/°C
Water Temperature °F/°C
50/10.0 70/21.1 90/32.2
70/21.1 1380 1280 1130
80/26.7 1380 1280 1120
90/32.2 1380 1300 1100
100/37.8 1370 1250 1090
Based on average ice slab weight of 10 - 11 lb
Air Temp.
Around Ice
Machine
°F/°C
Freeze Cycle Harvest Cycle
Discharge
Pressure
PSIG
Suction
Pressure
PSIG
Discharge
Pressure
PSIG
Suction
Pressure
PSIG
50/10.0 235-245 40-28 160-175 70-90
70/21.1 235-245 42-29 160-175 75-100
80/26.7 235-260 42-30 170-195 80-105
90/32.2 240-270 42-30 180-200 85-110
100/37.8 250-280 43-30 185-200 90-110
110/43.3 250-285 44-31 190-205 90-115
Suction pressure drops gradually throughout the freeze cycle