


Version 4 27 Feb 08
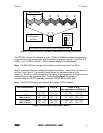
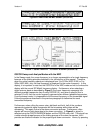
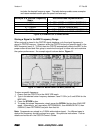
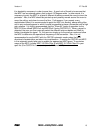
the F4 button to further analyze the signal, it is possible to analyze which antenna and
filter that is actually receiving the signal. Figure 9 shows the proper antenna selected and
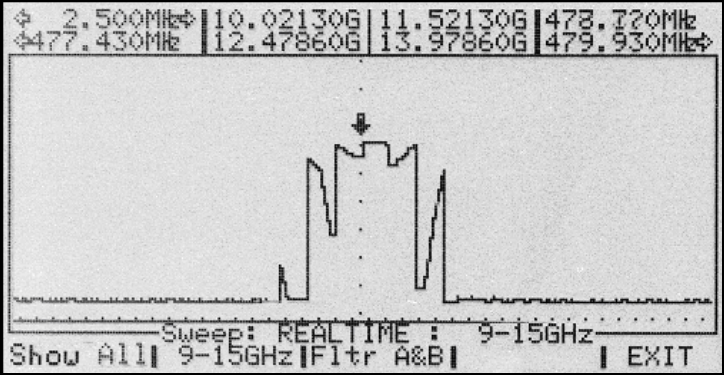
the proper filter selected which corrects the signal shape. Furthermore, the unusual signal
shape of Figure 8 indicates that this signal should be a Filter B signal.
Note: The OSCOR 5.0 software will not allow this type signal to be displayed.
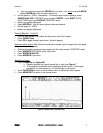
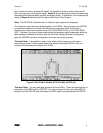
The frequency span limits are always between 0 and 3GHz. This is because the OSCOR
is a spectrum analyzer that covers the frequency range up to 3GHz, but the input
frequencies of the down-converter cover 3 to 21GHz (MDC-2100) or 3 to 9 GHz (MDC-
900). Therefore, the cursor frequencies provide the possible signal frequencies while the
span numbers (indicated at the top right and left of the display) provide the frequency
span the OSCOR is actually viewing after the down-conversion process.
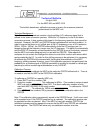
Technical Note: It is possible to have a very slight shift in frequency in the down-
conversion process. In the example below, the signal shifted about 50KHz; this is a
minimal shift considering the signal is at 10GHz.
Figure 8: SELECTING A SIGNAL WITH THE MDC (OSCOR 4.0)
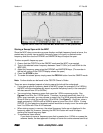
Technical Note: You may see false signals at 8.5 and 9GHz. These are produced by an
interaction of the MDC and the OSCOR. You may minimize this by moving the MDC a
few feet from the OSCOR and orientating the MDC metal housing towards the OSCOR.
REI MDC-2100/MDC-900 9