Home
The dashboard provides the following tabs:
They are described in the upcoming sections:
• Executive Summary, see 2
.2.1
• Traffic Volume, see 2.2.2
• System, see 2.2.3
Before this is done, however, the following subsection provides some general
information on the dashboard.
Handling the Dashboard
The dashboard allows you to view summary information on a number of Web-
washer and system parameters at a glance. This information is in most cases
displayed with regard to a particular time interval, e. g. the number of URLs
that were filtered by Webwasher over the last three hours.
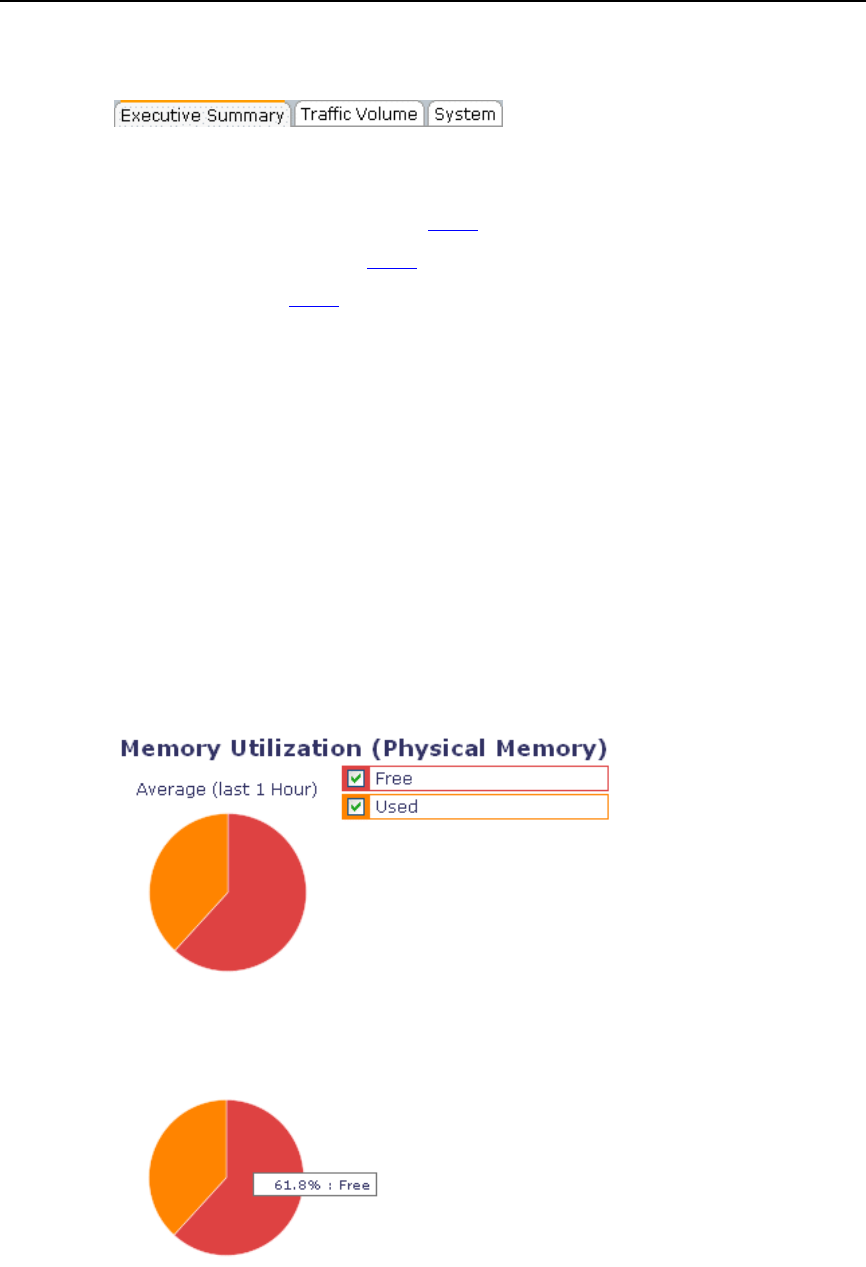
If percentages were calculated for a group of related parameter values, they
are shown by means of a pie chart on the left side of the corresponding tab
section:
By hovering over the sections of the pie chart wit
h the mouse cursor, you can
display the individual percentages:
2–3