Chapter 1 Overview
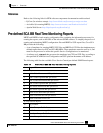
Pre-defined SCA BB Real-Time Monitoring Reports
Cisco SCA BB SNMP Real Time Monitoring User Guide
1-4 OL-12491-01
15 Subscriber Counters
16 RDR Counters
17 Downstream Bandwidth per TX Queue
18 Upstream Bandwidth per TX Queue
Reports
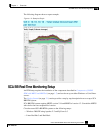
Note the following general information regarding charts:
• Each report is actually made of the following four charts, representing different time scales.
These charts are based on the round robin archives for each SNMP counter (the archives are
created by MRTG).
• Daily (5-minute average)
• Weekly (30-minute average)
• Monthly (2-hour average)
• Yearly (1-day average)
• The legend items for each graph item (including the total item) include the following
information for each item:
• Average value
• Maximum value
• Current value
• The data in each chart is a series of average values (a series of 5-minute-average values for the
daily chart, 30-minute-average for the weekly chart, and so on)
• Maximum value items do not show the actual highest value of the monitored counter in each
period, but rather the highest average value in the series, which is likely to be lower than the
actual maximum value.
• The colors of the chart items are taken from a pre-defined, non-configurable set of colors.


