


Liebert iCOM Control—Firmware Version XP1.00.010.STD
32
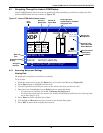
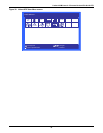
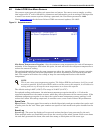
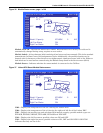
4.6 Graphical Data Record
The Graphical Data Record charts the average temperature from Sensors A and B and the supply
refrigerant temperature.
The temperature scales can be changed to expand or compress the data.
The time scale also can be altered to any of several selectable values.
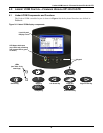
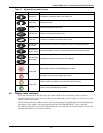
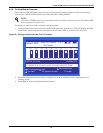
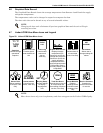
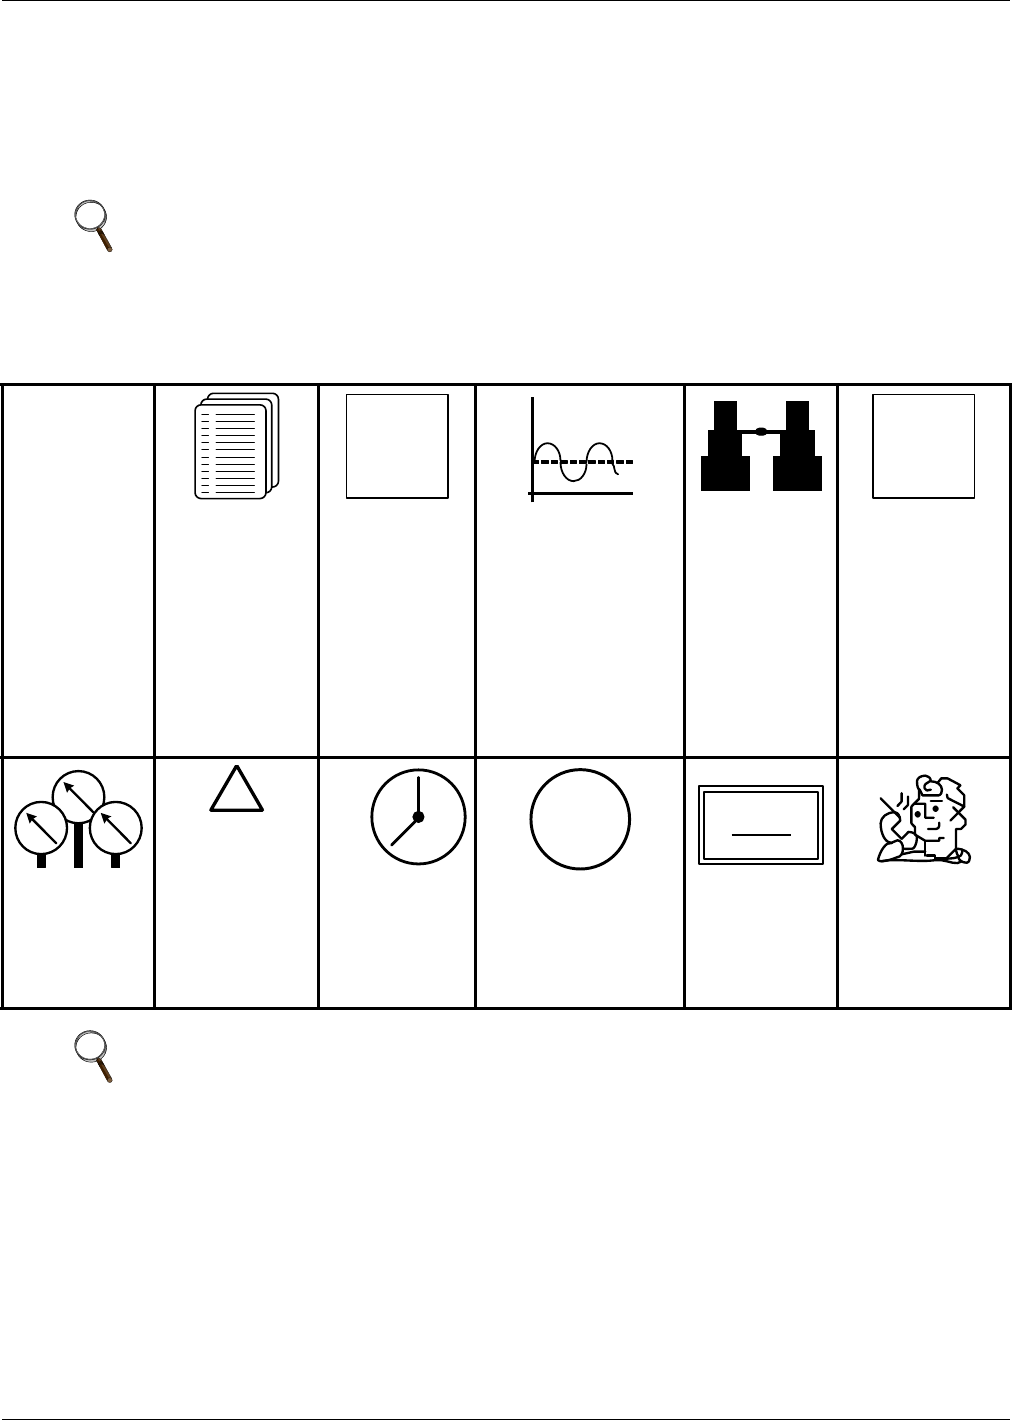
4.7 Liebert iCOM User Menu Icons and Legend
Figure 29 Liebert iCOM User Menu icons
NOTE
Changing the time scale eliminates all previous graphical data and the unit will begin
recording new data.
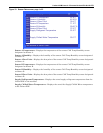
Setpoints
View and change
operational
setpoints
Spare Parts List
Contains spare
parts available on
site
Event Log
Lists last 400
events and
alarms
View Only
Graphic Data Record
Displays average
temperature from
Sensors A and B, the
average dew point from
Sensors A and B, the
supply refrigerant
temperature and the
supply refrigerant control
point graphs; Data is
View Only; Display scale
is adjustable
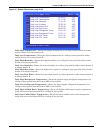
View Network
Shows status of
all connected
units; View Only
Set Alarms
Allows user to
change settings for
alarms
Sensor Data
Shows readings
of sensors; View
Only
Active Alarms
Lists all current
alarms; View Only
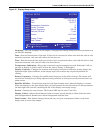
Display Setup
Change settings
for display:
language and
time
Total Run Hours
Records the run time of
all components and
allows setting of limits on
run time; View Only
Smart Modules
Displays
readings for the
individual smart
modules; View
Only
Service Contacts
Contains key
contact information
for service
NOTE
Menu shows icons only; text is explanatory and does not appear on the Liebert iCOM display.
°C / °F
% RH
SET
EVENT
LOG
SET
ALARMS
!
ACTIVE
ALARMS
1 2
39
6
SET
1234h
XDIO