Chapter 5
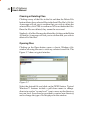
Viewing Files
65
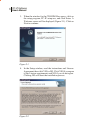
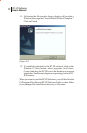
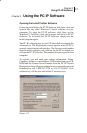
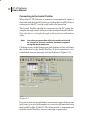
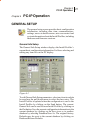
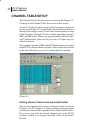
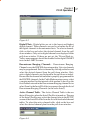
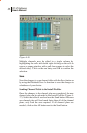
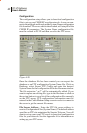
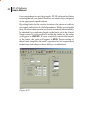
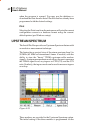
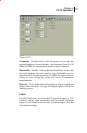
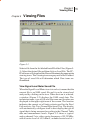
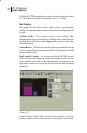
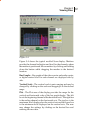
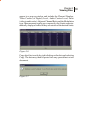
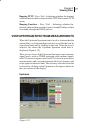
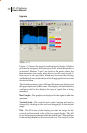
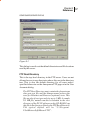
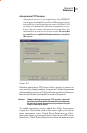
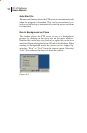
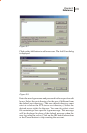
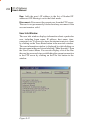
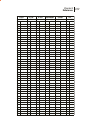
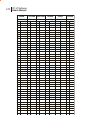
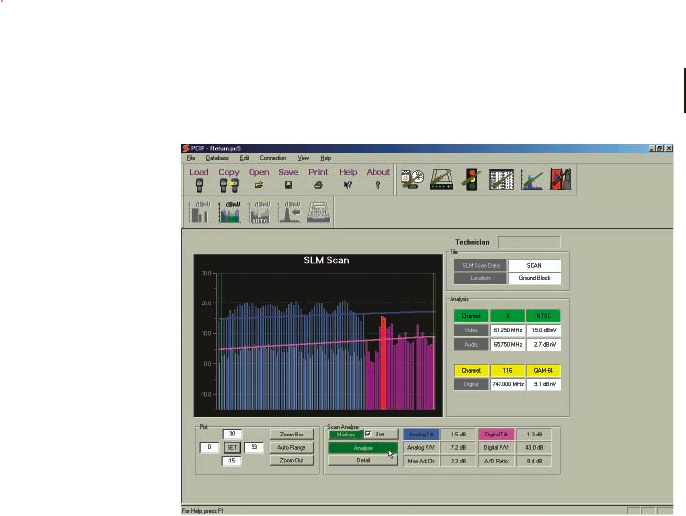
Figure 5-4
Figure 5-4 shows the typical recalled Scan display. Markers
provide the channel indication and level for the channels where
the marker is positioned. Move markers by clicking and holding
down the button while dragging the marker to the desired
location.
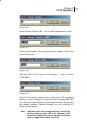
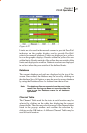
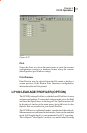
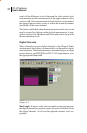
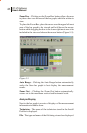
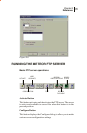
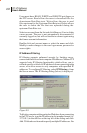
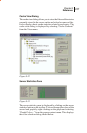
Bar Graphs – Bar graphs of the video carrier and audio carrier,
or digital carrier level for each channel are displayed side by
side.
Vertical Scale - The vertical scale is auto ranging and may be
changed by clicking on the scale and dragging it to the desired
range.
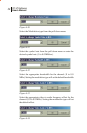
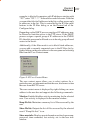
Plot - The Plot area of the display provides the range for the
vertical and horizontal scale of the bar graph display. The left
box is the beginning channel of the horizontal axis. The right box
is the ending channel on the horizontal axis. The top box is the
maximum level displayed on the vertical axis and the lower box
is the minimum level displayed on the vertical axis. The user
may change the settings by clicking on the desired box and
entering the new data.