Chapter 5
Viewing Files
79
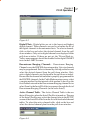
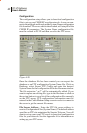
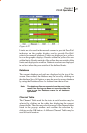
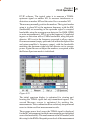
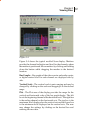
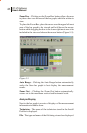
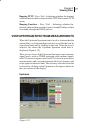
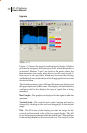
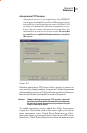
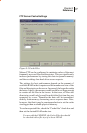
maximum level displayed on the vertical axis and the lower box
is the minimum level displayed on the vertical axis. The user
may change the settings by clicking on the desired box and
entering the new data.
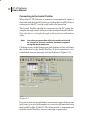
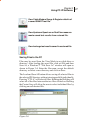
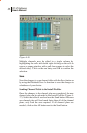
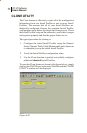
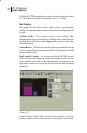
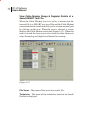
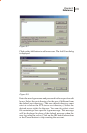
Zoom Box – Clicking on the Zoom Box button allows the user
to place a box over the area of the bar graph that he wishes to
view.
To place the Zoom Box, place the cursor over the upper left most
area of the bar graph to be viewed and hold down the mouse
button while dragging the box to the lower right most area to be
included in the view and release the mouse button.
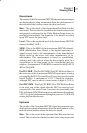
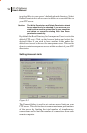
Auto Range – Clicking the Auto Range button will automatically
scale the Scan bar graph to best display the measurement results.
Zoom Out – Clicking the Zoom Out button will automatically
zoom out to the maximum vertical and horizontal scale.
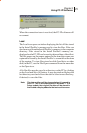
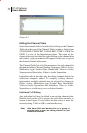
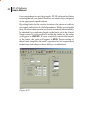
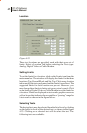
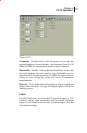
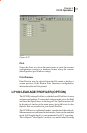
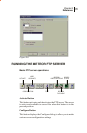
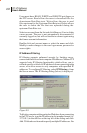
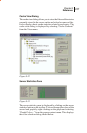
File
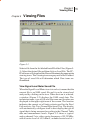
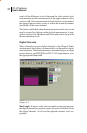
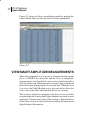
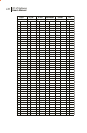
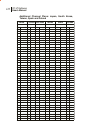
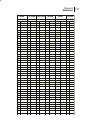
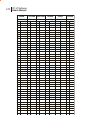
Next to the bar graph is a series of displays of the measurement
information in tabular form.
Technician - The name of the technician stored in the Install
Profiler is displayed.
File - The type and name of the file being viewed are displayed.
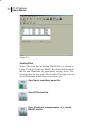
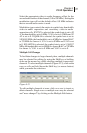
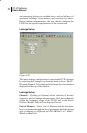
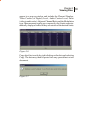
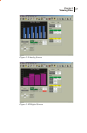
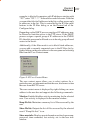
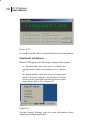
Markers – Two measurement markers are provided. Yellow
and purple markers are displayed on the bar graph. The marker
color corresponds to the color of the tabular display. Markers
may not be moved since their measurement criteria was defined
in the Install Profiler setup and cannot be changed once the file
is saved.
Yellow Marker – Displays the frequency and result of a
measurement of the level of analog signals in dBmV (typically
ingress or beats).
Purple Marker – Displays the frequency and result of a
measurement of the level of noise in dBmV (bandwidth
compensated).