Chapter 5
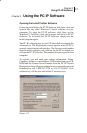
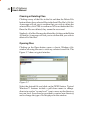
Viewing Files
67
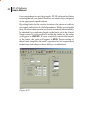
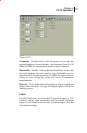
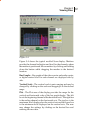
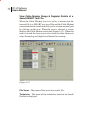
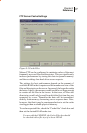
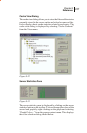
Location – The location indicates the current set of Limits
criteria used for the Pass/Fail analysis: Set-Top, Ground Block,
or Tap.
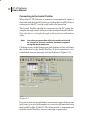
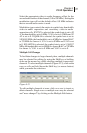
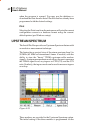
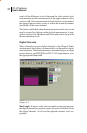
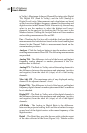
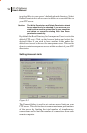
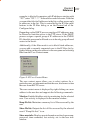
Markers – Two measurement markers are provided by clicking
on the Markers button. A green and a yellow marker are
displayed on the bar graph. The marker color corresponds to the
color of the tabular display. To move a marker, click on it and
drag it to the desired location.
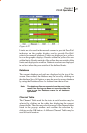
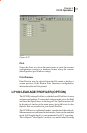
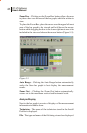
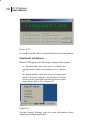
Channel 1 – The channel number and modulation type of the
selected channel (initially left) are displayed. The green marker
depicts Marker 1. Analog channels are displayed with video and
audio carriers; digital carriers have only one bar and one
measurement.
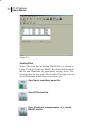
Video / Digital – Displays the frequency and result of a
measurement of the video carrier peak level or average power
level of a digital channel in dBmV.
Audio 1 – Displays the result of the measurement of the primary
audio carrier level in dBmV (not present if a digital channel is
selected).
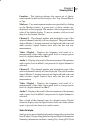
Channel 2 – The channel number and modulation type of the
selected channel (initially left) are displayed. The yellow marker
depicts Marker 2. Analog channels are displayed with video and
audio carriers; digital carriers have only one bar and one
measurement.
Video / Digital – Displays the frequency and result of a
measurement of the video carrier peak level or average power
level of a digital channel in dBmV.
Audio 2 – Displays the result of the measurement of the primary
audio carrier level in dBmV (not present if a digital channel is
selected).
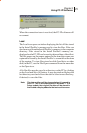
One or both of the channels may be a digital carrier. Digital
channels display only the digital carrier level; the Audio carrier
space is grayed since there is no audio carrier.
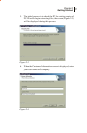
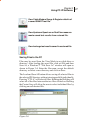
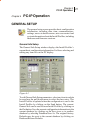
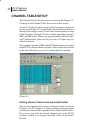
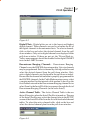
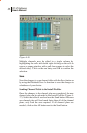
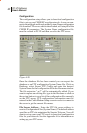
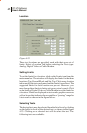
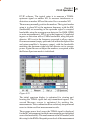
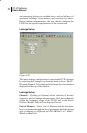
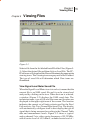
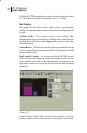
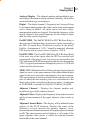
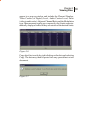
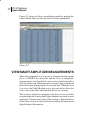
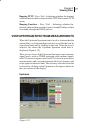
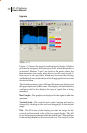
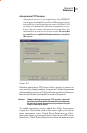
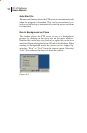
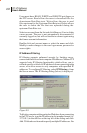
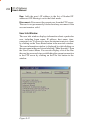
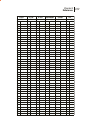
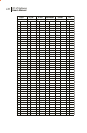
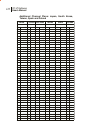
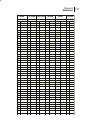
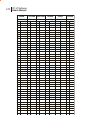
Scan Analyze
Analyze gives more detailed information about the results of the
Scan (Figure 5-6) providing both Analog and Digital information.
Summary information includes: Analog Tilt, Analog P/V (Peak