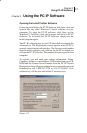
PC-IP Software
User’s Manual
68
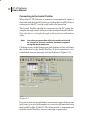
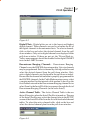
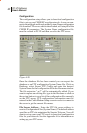
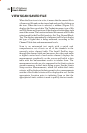
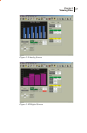
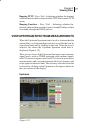
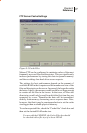
to Valley), Maximum Adjacent Channel Deviation plus Digital
Tilt, Digital P/V (Peak to Valley), and the A/D (Analog to
Digital Level) ratio. Measurements and calculations are based
on the lowest and highest frequency channel for the analog and
digital carriers in the Channel Table. Alternatively, the user may
select to use the markers to select the highest and lowest
channels for the analysis by checking the Use box next to the
Markers button. Clicking the Analyze button will turn markers
and resulting measurements On and Off.
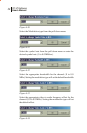
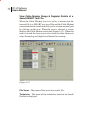
Use – Checking the Use box will switch the Analyze data from
measurements and calculations based on the lowest and highest
channel in the Channel Table to measurements based on the
current marker positions.
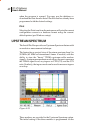
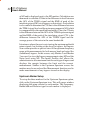
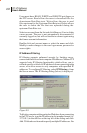
Analyze - Click the Analyze button to turn the markers and the
resulting measurements On or Off. The following measurements
are provided.
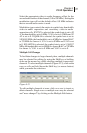
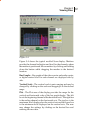
Analog Tilt - The difference in level of the lowest and highest
frequency analog channel or marker placement if the Use
markers box is checked.
Analog P/V - The Peak-to-Valley ratio of the analog channels is
the difference between the maximum and minimum (positive
and negative) from the ideal tilt (slope) of all of the analog
channels.
Max Adj. CH - The maximum ratio of any displayed analog
channel to its adjacent channel’s level.
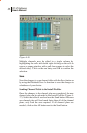
Digital Tilt - The difference in level of the lowest and highest
frequency digital channel or marker placement if the Use markers
box is checked.
Digital P/V - The Peak-to-Valley ratio of the digital channels is
the difference between the maximum and minimum (positive
and negative) from the ideal tilt (slope) of all of the digital
channels.
A/D Ratio - The Analog to Digital Ratio is the difference
between the projected analog level and the calculated average
power level of the digital carriers at the mean frequency of the
digital carriers.
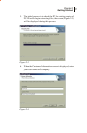
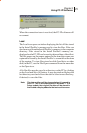
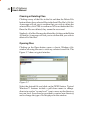
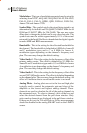
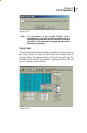
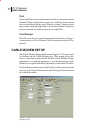
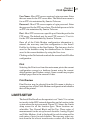
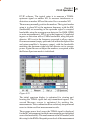
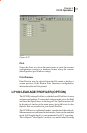
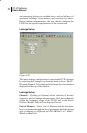
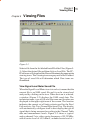
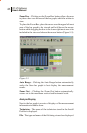
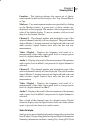
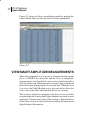
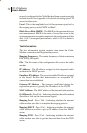
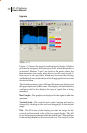
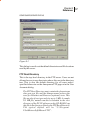
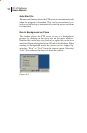
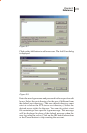
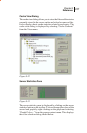
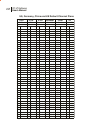
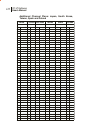
Detail - The Detail key provides the user with a tabular report
of the data collected in the Scan (Figure 5-6). Tabular results