


Using ipView
Nortel Networks ipView Software Wallboard Set Up and Operation Guide Issue 04
14
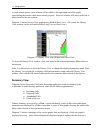
As each minute passes a new column will be added to the right hand end of the graph
representing the minute which most recently expired. Previous columns will move to the left to
make room for the new column.
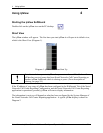
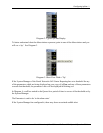
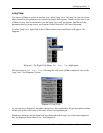
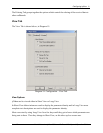
Diagram 12 shows History View graph with ipView in Short View. (Of course, the History
View window can be activated in either Long View or Short View.)
Diagram 12: History View with ipView in the Short View.
To close the History View window, click once more on the selected parameter abbreviation or
description.
Note: You do not have to close the History View to change the displayed parameter trend. With
the History View displayed, to display a different parameter trend within the History View
window click with the left mouse button on the new parameter abbreviation or description.
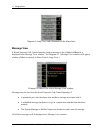
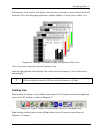
Summary View
When the Nortel Networks Call Center Reporting application sends a summary to the
wallboards, it sends the daily and hourly totals for the following parameters:
• Incoming Calls
• Outgoing Calls
• Abandoned Calls
• Grade of Service
When a summary is received by ipView, it stores the hourly values so that when subsequent
summaries are displayed by ipView it can show a series of four graphs showing the trend of the
daily values of each of these parameters in turn.
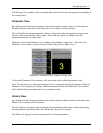
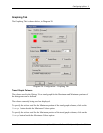
Diagram 13 shows a montage of the various graphs that are displayed. (Only one graph is
displayed at a time. After a short duration the displayed graph is replaced by the next one.)