


Configuring ipView 21
Issue 04 Nortel Networks ipView Software Wallboard Set Up and Operation Guide
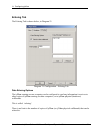
Graphing Tab
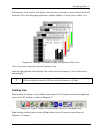
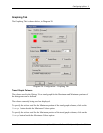
The Graphing Tab is shown below, in Diagram 20.
Diagram 20: Configuration – Graphing Tab.
Trend Graph Colours
The colours used in the History View trend graph for the Maximum and Minimum portions of
the histograms can be defined.
The colours currently being used are displayed.
To specify the colour used for the Minimum portion of the trend graph columns, click on the
Change button beside the Minimum Colour option.
To specify the colour used for the Maximum portion of the trend graph columns, click on the
Change button beside the Maximum Colour option.