


Chapter 2 Operating Your Frequency Counter
Using Power Correction
Operating Guide 2-31
2
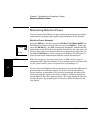
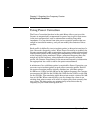
Power Correction Theory of Operation
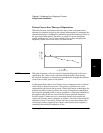
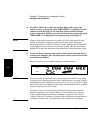
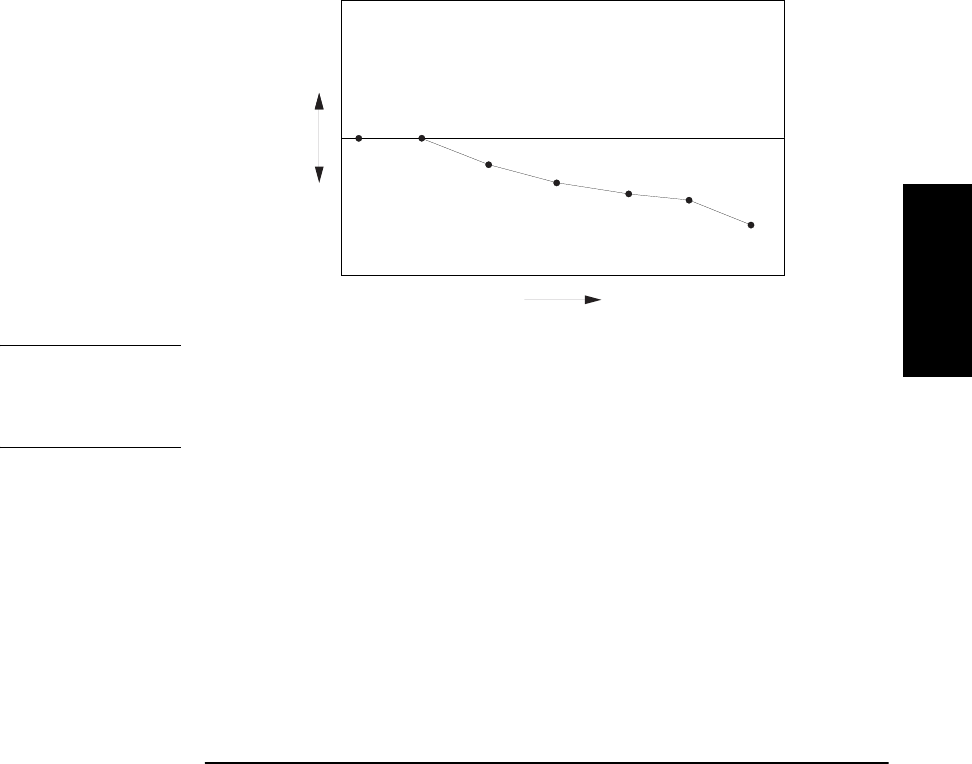
When the Counter interpolates between data points to determine the
amount of correction to apply to the current measurement, it computes the
correction based on a straight line plotted between the frequency values in
the two closest data points. Therefore, a graph of a power-correction
profile would show a “curve” that consists of two to nine straight-line
segments, rather than a true curve, as shown below.
NOTE When the frequency value of a signal is beyond either end of the curve
specified by the values in the currently selected profile’s data points,
the Counter computes a correction by extending the straight line defined
in the last two data points in the profile.
As the graph above shows, the Counter never computes power-correction
values for loss above the zero axis. Conversely, corrections are never
computed for gain below the zero axis. When the Counter interpolates for
frequencies that are above or below the range of frequencies specified in
the currently selected profile, it never computes a value that would fall on
the opposite side of the zero axis from the closest specified frequency.
In other words, if there are two or more data points that contain loss
values, the Counter never computes or applies a correction that would be
indicative of gain. Conversely, if there are two or more data points that
contain gain values (negative loss values), the Counter never applies a
correction that would be indicative of loss.
P
o
w
e
r
F r e
q
u e n c
y