


Page
32
The data view window will display six columns of data when set into dual link mode, or
three columns when in single link mode.
The contents of the Data View window may be saved as a .txt file. (See the section on
window menus on page 45). The file will include all the data within the scrollable
window, so if the window is set to contain 100 samples, then these 100 samples will be
saved in that txt file. The data will be stored in the file in whichever base they were being
displayed in. I.e. the file will contain decimal, hexadecimal or binary values as selected
for the window.
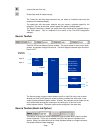
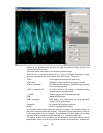
The contents of the data view window are colour coded. In all cases, the text remains
white, but the background colour changes to show the nature of the data.
Green indicates pixel is within active video
Blue indicates pixel is within a TRS packet
Purple indicates pixel is within an ANC packet
Light grey indicates pixel is within horizontal blanking
Black indicates pixel is within vertical blanking for field 2
Dark grey indicates pixel is within vertical blanking for field 2
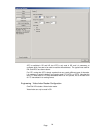
Red indicates a data range error (i.e. video data outside the range that has been set on
the Engineering menu). With Dual Link products, there is no guarantee that this range is
valid for the actual data type on the serial inputs. Hence it is important to ensure that the
data ranges expressed on the Engineering menu reflect the type of data you are
expecting.
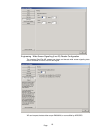
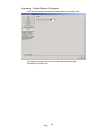
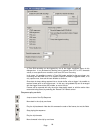
Like other windows, the data displayed can be configured from the drop down menus
contained within the window.
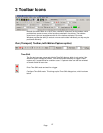
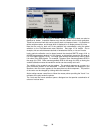
Enable/Disable the video status window. This window lets you view the status on various
video parameters, and provides controls to enable counters for various error conditions.
For example, you can count the number of CRC or ANC errors from a given time.
For each given error type, you can display the errors in the following formats.
Display the word ERROR on a red background.
Display a continuous count of the number of errors since the last reset.
Display an error rate in errors per second.
Display the time since the last error or since the error count was last reset, as
appropriate.
In all modes, the background colour indicates if errors have been detected, with red
indicating an error.
The contents of the Video Status window are described in the section on OmniView
Video Checking Features, starting on page 48.
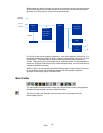
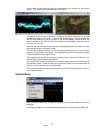
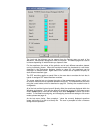
Enable/Disable the audio status window. This window displays information about the
current audio status, and also contains the PPM meters. The PPM meters can display
audio levels from two of the four available audio groups. The choice of which two audio
groups is made from the Analyzer menu. The graticule can be changed using the menus
on the window. Refer to page 48 for details.
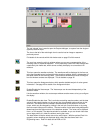
This icon opens the logging window. The window shows a live display of data that can
be logged. This is fully described in Appendix A2, together with other related material.
Open the cage generator (safe area/title) dialogue box. For a full description of this,
please refer to page 46 in this manual.
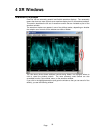
This button opens or closes the ‘Region of Interest’ control window, which is described on
page 43.