6712FR Refrigerated Sampler
Section 4 Standard Programming
4-20
4.15.4 Sampling Results
Report
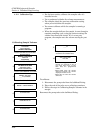
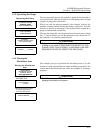
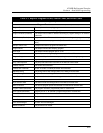
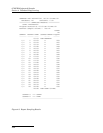
As the sampler runs a program, it records the program’s events.
Program events include such items as sample events, program
enables and disables, power losses, and so on. Table 4-3 lists each
event with a short description. You can view the report by fol-
lowing the steps in Viewing the Data on page 4-18 or print the log
as the Sampling Results report.
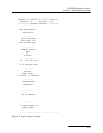
In the text file version of the report, sample-event entries include
the time of the event as well as the sample and bottle numbers.
The sample column contains the sample number deposited into
the bottle. This information reflects the distribution selected for
the program.
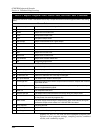
The letters in the Source columns are codes for the cause of the
event. The letters in the Error column are codes for the causes of
missed samples. The source and error codes appear with expla-
nations at the end of the report. A list of codes appears in Table
4-3.
The last column in the Sampling Results report records the
pump counts for the sample event. Large variations in pump
counts from event to event indicate fluctuating heads, a relocated
suction line, or a temporarily clogged strainer.
4.15.5 Combined Results
Report
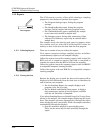
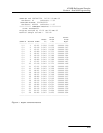
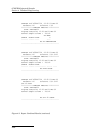
At the time of each sample event, the sampler records the
readings from each connected module, rain gauge, or SDI-12
sonde. The Combined Results Report presents the event time,
sample and bottle number, and the respective readings from the
device.
For flow modules, the readings are level and flow rate. For the
pH module, the readings are temperature and pH. For the rain
gauge and SDI-12 Sonde, the readings vary according to the
selections enabled during the hardware setup in extended pro-
gramming. When recording four or more sonde parameters, the
Combined Results report will exceed the standard 40 character
width. To read the additional columns, the data must be collected
with Flowlink 4 for Windows software.
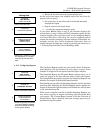
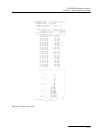
4.15.6 Summary Report This report summarizes the rain gauge or module data. The
types of readings are the same as those available to the Com-
bined reports. The sampler compiles the data to present a daily
total, the day’s average, maximum, and minimum reading, and a
listing of hourly averages. The sampler then graphs the day’s
readings.


