


110
Measurement Functions 3M™ Dynatel™ Advanced Modular System 965AMS
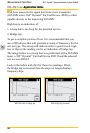
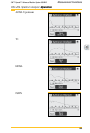
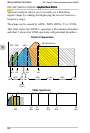
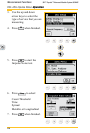
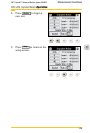
DSL>DSL Spectrum Analyzer>Application Notes
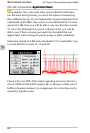
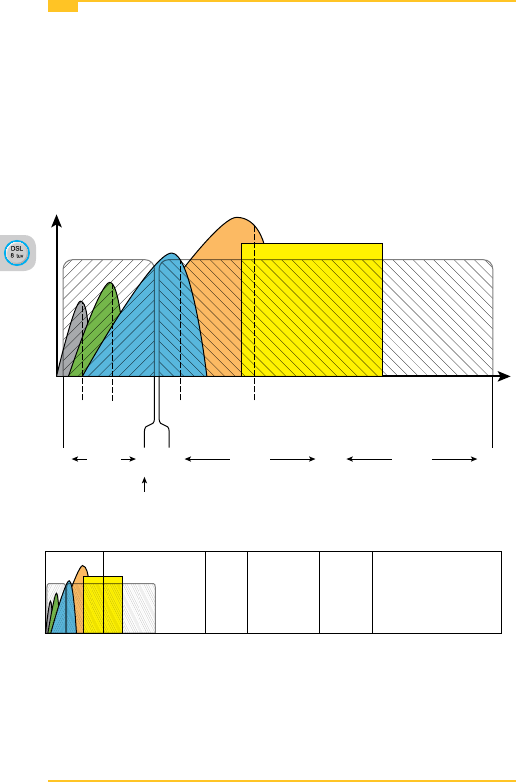
Spectrum analysis allows you to visually see a disturbing
signal’s shape by reading and displaying the level of noise in a
frequency range.
The shape can be caused by ADSL, ISDN, HDSL, T1 or VDSL.
This chart shows the ADSL2+ spectrum with common disturbers
and chart 2 shows the VDSL spectrum with potential disturbers.
Center Frequencies
28
kHz
20
kHz
ADSL
Upstream
ADSL
Downstream
ADSL
Downstream
138
kHz
Nyquist
Frequency
140
kHz
1100
kHz
2200
kHz
DDS ISDN HDSL
T1 AM Radio 680 kHz+
40
kHz
196
kHz
772
kHz
1.1
MHz
US 0 DS 1 US 1 DS 2 US 2 US 2
3.75
MHz
5.2
MHz
8.5
MHz
12
MHz
30
MHz
VDSL Spectrum