


YORK INTERNATIONAL
82
FORM 160.55-O1 (604)
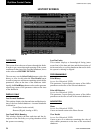
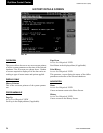
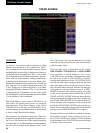
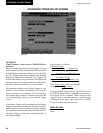
TREND SCREEN
00480VIP
FIG. 37
OVERVIEW
As many as six Operator selected parameters (Data
Points) can be plotted in an X/Y graph format. The X-
Axis is scaled per the selected Data Collection Interval
and dis played in a time of day or elapsed time format, as
se lect ed with the X-axis toggle key. The Y-Axis is scaled
for each parameter per the selected minimum and max-
i mum val ue for each parameter. Analog pa ram e ters are
scaled in pressure, temperature, volts, amps, hertz or time.
Dig i tal on/off parameters are scaled as zero (off) and one
(on). Only one Y-Axis label is displayed at a time. The
Y-Axis Toggle Key is used to toggle the Y-Axis labels
through the different pa ram e ters. The Y-Axis la bel that
is being displayed is iden ti Þ ed at the top of the graph.
For iden ti Þ ca tion, each plot ted parameter and as so ci at ed
Y-Axis labeling is color coordinated.
With Flash Memory Card version C.MLM.02.01.xxx
and earlier, all trended Data Points are displayed
si mul ta neous ly. With Flash Memory Card version
C.MLM.02.02.xxx and later, the DATA SELECT key
is used to display all trended Data Points si mul ta neous ly
or select a single Data Point for display.
The parameters are sampled at the selected Data Col-
lec tion Interval and plotted using 450 data points across
the X-Axis. If the actual value of the sampled pa ram e ter
is less than the Y-Axis label minimum for that pa ram e ter,
the value will be plotted at the minimum val ue. Simi-
larly, if the actual value is greater than the Y-Axis label
maximum for that parameter, the value will be plot ted
at the maximum value.
There are three types of charts that can be created:
ONE SCREEN, CONTINUOUS or TRIG GERED
(not applicable to Flash Memory Card version
C.MLM.02.01.xxx and earlier). When plot ting reaches
the end of the X-axis, if ONE SCREEN is selected,
trending stops and data is frozen. If CONTINUOUS is
selected, the oldest data is dropped from the left-hand
side of the graph at the next collection interval. There-
af ter, the oldest data is dropped from the left hand-side
of the graph at each data collection interval. If TRIG-
GERED is selected, data collection can be set to start
or stop based upon the selected TRIGGER ACTION
(START or STOP). If START is selected, data col lec tion
will not begin until the Triggers have been satisÞ ed and
any selected TRIGGER DELAY has elapsed. Data col-
lection will stop at the completion of one screen of data
as with the ONE SCREEN. If STOP is selected, data col-
lection will not stop un til the Trig gers have been satisÞ ed
and any selected TRIGGER DELAY has elapsed.
If a power failure occurs while the trend ing is running,
the trending is stopped. Upon restoration of power, the
last screen of data that was collected will be displayed
on the trending screen. The START key must be pressed
to initiate a new trend screen.
OptiView Control Center