


YORK INTERNATIONAL
84
FORM 160.55-O1 (604)
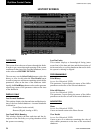
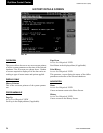
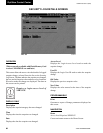
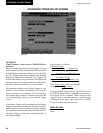
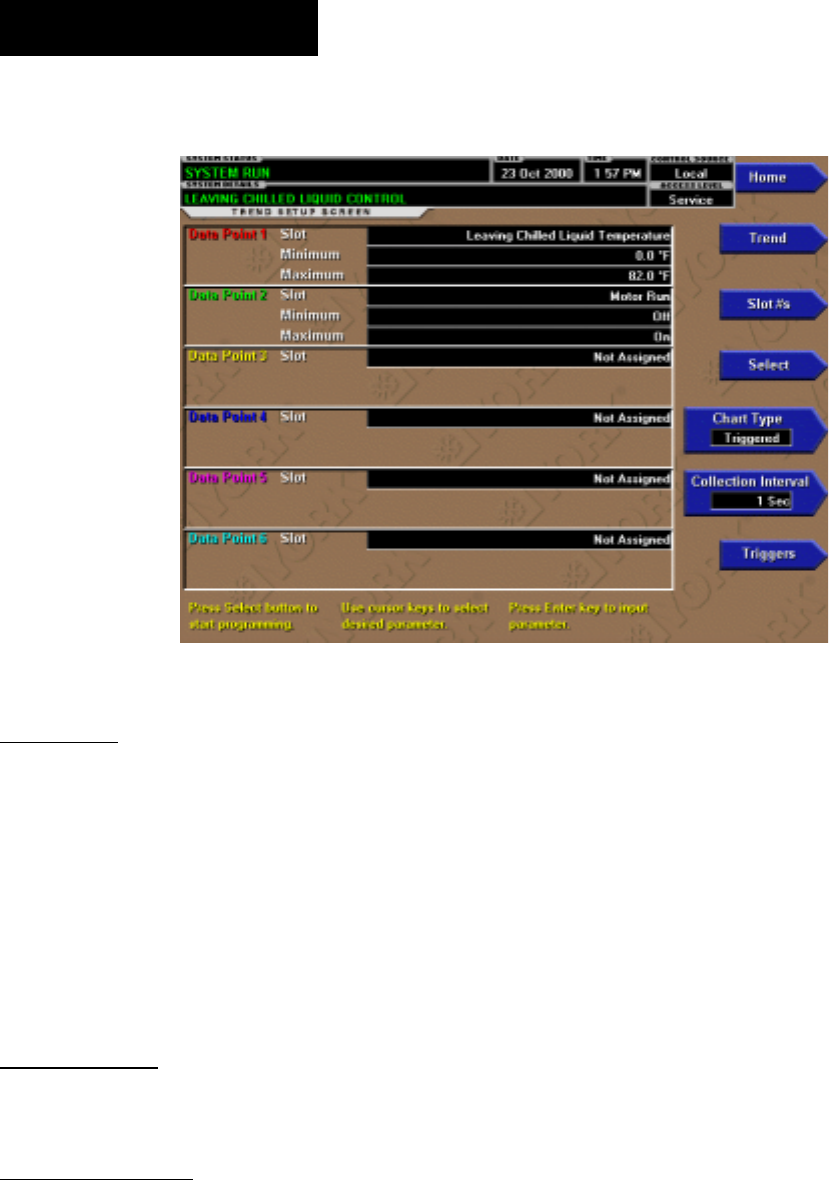
TREND SETUP SCREEN
OVERVIEW
This screen is used to conÞ gure the trending screen.
The parameters to be trended are selected from the
Common Slots Screen or Common Slots Master list
and entered as Slot Numbers for Data Points 1 through
6. The Y-Axis minimum and maximum values for each
parameter are entered as Data Point Min and Data Point
Max for Data Points 1 through 6. The interval at which
all the parameters are sampled is selected as the Data
Collection Interval.
DISPLAY ONLY
None
PROGRAMMABLE
Chart Type
Access Level Required: OPERATOR
(Flash Memory Card version (C.MLM.02.02.xxx and
lat er) Selects CONTINUOUS, ONE SCREEN or
TRIG GERED type of graph.
Collection Interval
Access Level Required: OPERATOR
Selects the interval at which the parameters are sam pled.
There are 450 data points displayed across the X-Axis
of the graph. Each point represents the instantaneous
value of the parameter. The user selects the time in-
ter val between these points. This is called the DATA
COL LEC TION INTERVAL or the interval at which the
pa ram e ter is sampled. This interval is programmable
over the range of 1 second to 3600 seconds (1 hour), in
one second increments. The selected interval not only
de ter mines the sample interval, but also the full screen
time display. The full screen time display is a result of the
selected interval in seconds, multiplied by the 450 data
points. For example, if the Data Collection In ter val is
programmed for 900 seconds, the parameter would be
sampled every 900 seconds, with the last 112.5 hours
(4.7 days) of data viewable on the screen. There fore, the
selected interval is a compromise between res o lu tion
and full screen time display. Select the desired Data
Collection Interval as follows:
1. Determine the desired time interval (in sec onds),
be tween data samples.
2. Calculate the full screen time display as follows:
450 x Data Collection Interval = full screen sec onds
full screen seconds / 60 = full screen minutes
full screen minutes / 60 = full screen hours
full screen hours / 24 = full screen days
3. Decide if the resultant sample interval and full screen
display meet the requirements. If not, select a dif-
fer ent sample interval.
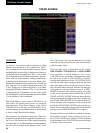
00481VIP
FIG. 38
OptiView Control Center