


2-35
Making Measurements
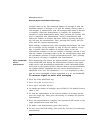
Measuring Modulated Lasers
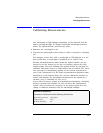
The graphical display is useful for locating these spurious wavelengths.
Their amplitude will be below that of the correct wavelength and they
will be broad, rounded peaks compared to the sharp peak of the cor-
rect wavelength. Use the Peak Threshold function to place the dotted
line above the spurious peaks so they will not be displayed in the List
by WL or List by Power table.
A laser modulated at high frequency (in the RF or microwave range)
can also cause spurious wavelengths to be displayed, especially when
the modulation is of a repetitive nature such as that of PRBS or
SONET digital formats. In general, no spurious wavelengths will be dis-
played using preset instrument conditions. The preset condition
includes peak excursion, peak threshold, and wavelength range limit-
ing. However, increasing peak threshold can cause spurious wave-
lengths to be displayed.
Even when the laser being tested is modulated with repetitive formats,
the carrier’s correct wavelength and power is displayed; the wave-
length and power of the spurious sidebands are incorrect.
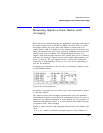
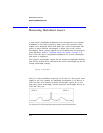
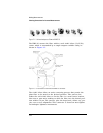
The graphical display is useful to see the effects of high frequency
modulation. Without modulation, the noise floor is typically 45 dB
below the laser power. In general, high frequency modulation will raise
the noise floor to about 25 dB below the laser power. The noise floor
is typically flat, or white. The actual level of the noise floor depends
on the type of data format and the data rate.
PRBS modulation graph showing raised noise floor.