Viewing Logs and Graphs Operator’s Guide to Using the E2 • 12-15
and time on which the reset occurred will be shown beside
the report priority.
12.10.9 Facility Status Display (FSD)
Alarms
The FSD can be used to handle alarms. Information
such as time stamp, alarm ID string, current status, the rea-
son an alarm was triggered, (if a case temp limit was
exceeded) configured priority of the advisory, Return-To-
Normal information, and if
available, the limit that was
exceeded can be viewed through the FSD. Alarms cannot
be configured from the FSD unit.
If more than one E2 controller is at a site, one E2 must
be s
et up as the alarm annunciator for that site. The FSD
will receive alarms from that alarm-annunciator E2 for the
entire site. The FSD will point only to a single E2 at a site
(it will not poll multiple controllers for alarms). For more
information, refer to the FSD Manual (P/N 026-1400).
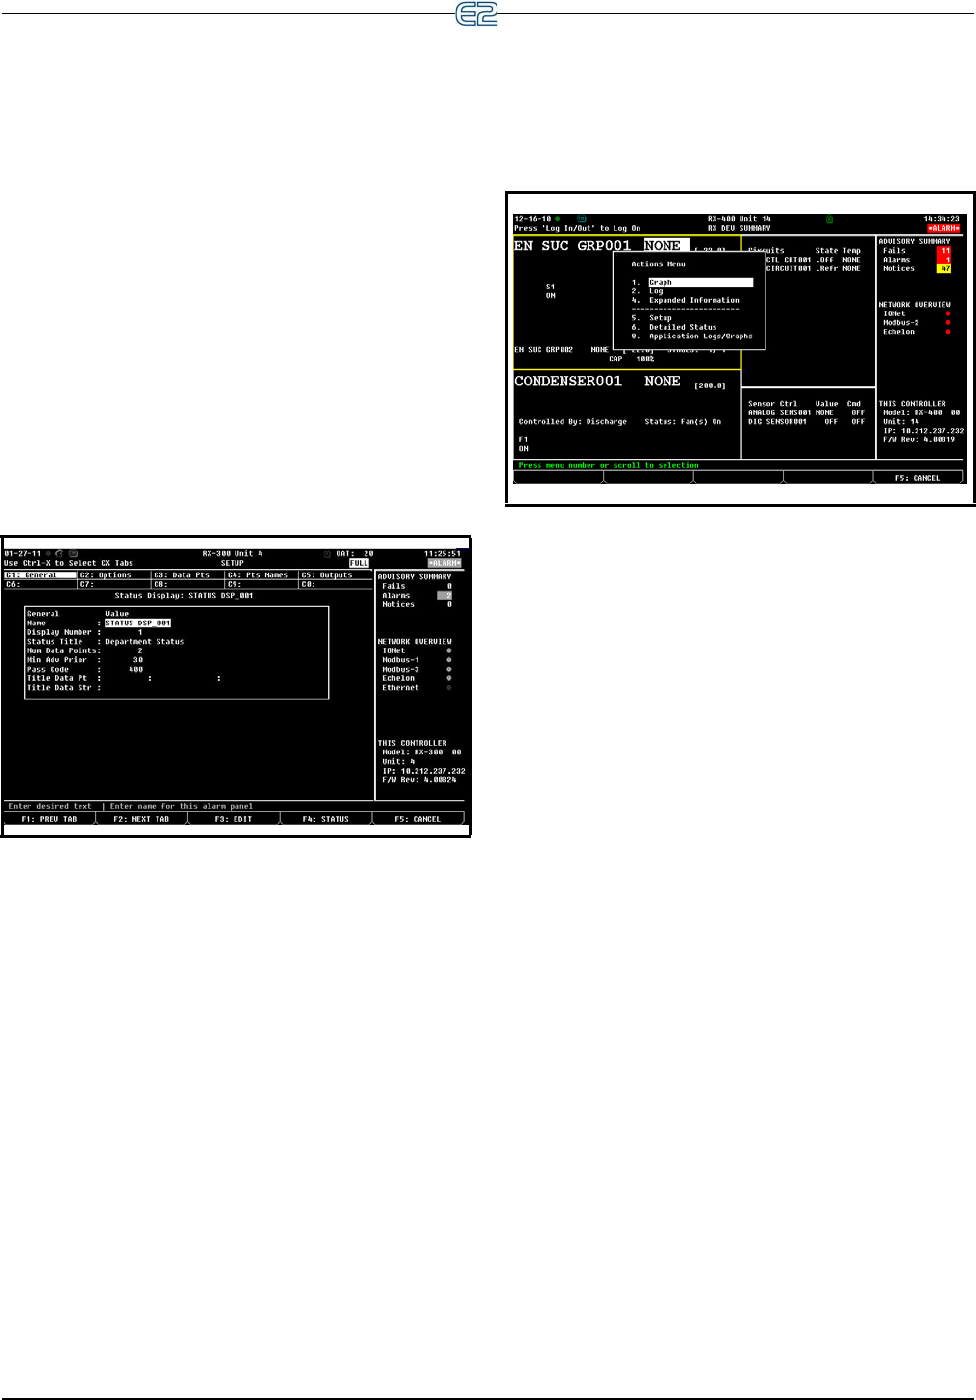
Figure 12-23
- FSD General Setup
12.11 Viewing Logs and
Graphs
There are two basic forms used by the E2 to display
data: logs and graphs.
A log is simply a list of sampled values for a particular
inp
ut or output along with the sampling times and dates.
When you view logged data in this form, it is usually listed
with the most recent sample at the top of the list, and the
other samples listed below it in reverse chronological
order.
A graph is a graphical representation of these log
entries that show
s how the sampled value has changed
over time. Graphing is a quick, easy way to get an idea of
how the application has been behaving. Special graphing
features also allow you to zoom in on specific areas of the
graph.
12.11.1 Locating Logged Inputs/
Outputs
12.11.1.1 Home/Status Screens
Figure 12-24 - Sample Actions Menu From RX Home Screen
The easiest way to access a log or graph is from the
Actions menu while on the Home screen or an applica-
tion’s Status screen. These screens contain a number of
di
fferent input and output values from the application. If a
particular input or output is being logged by the E2 and
has log data stored in the system, you can view the log or
graph by following the instructions below:
1. Use the arrow keys to highlight the desired input
or
output on the Home or a Status screen.
2. Press
to call up the Actions Menu, and
select either option
to view a graph or to
view a log.
If Graph and Log options are not listed in the Actions
Menu
, this means the property you have selected is not set
up to be logged.
It may also be the case that there are currently no
lo
gged values to be viewed (this often happens when a
controller is first set up or after a log has been cleared). If
this is the case, E2 will tell you that no logged samples
exist. For a complete list of items in the Actions Menu,
refer to Section 10.7.3, The Actions Menu.
