Naming Conventions for E2 Controllers, Applications, and Points Operator’s Guide to Using the E2 • 12-17
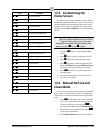
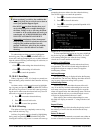
2. Select Log, and the Log screen opens.
Several function keys may be used to navigate the Log
view and provide additional information:
• BEGIN
NING - Move the cursor to the top of
the table (the most recently recorded sample).
• EN
D - Move the cursor to the bottom of the
table (the oldest sample).
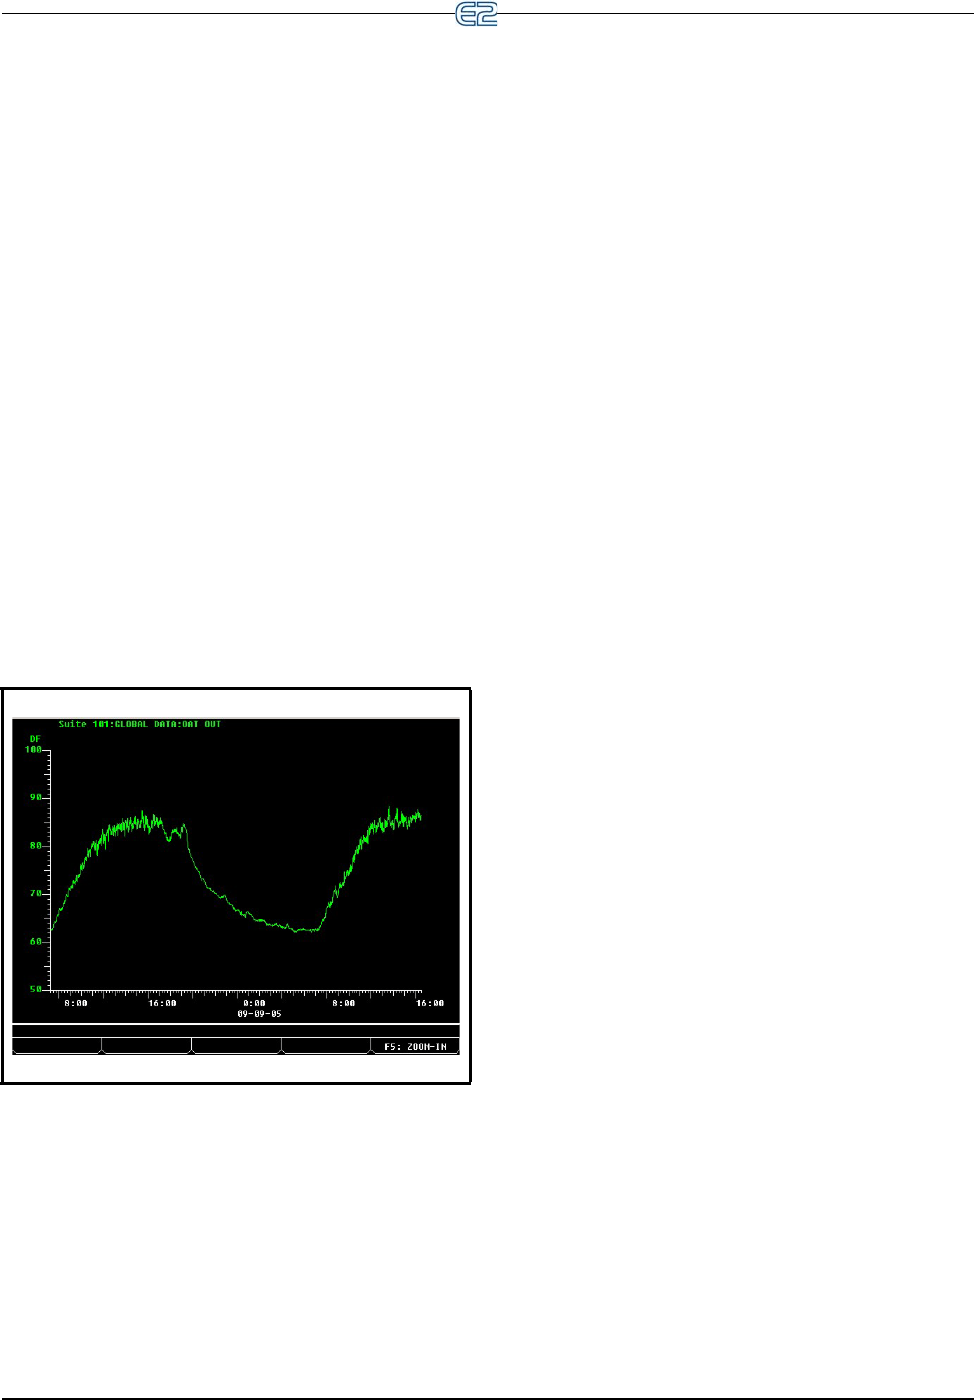
• GRAPH - Di
splays logged data in a graph
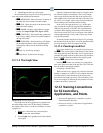
format (see Sample Graph View Figure 12-28).
• UPDT
DATA - Pressing this key updates the
Log View by adding all newly recorded samples to
the top of the table.
•
EXPD INFO - Pressing this key will display
the board/point address or the controller/applica-
tion/property address for the point that is being
log
ged.
•
Page Up - Scrolls up one page.
•
Page Down - Scrolls down one page.
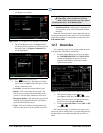
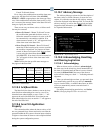
12.11.3 The Graph View
Figure 12-28 - Sample Graph View
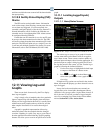
The Graph view shows logged data in a graphical for-
mat with sample times as the X (horizontal) coordinate
and sample
values as the Y (vertical) coordinate. To access
a graph view:
1. Highlight a value from any screen and press
to open the Actions Menu.
2. Select G
raph, and a graphed view of the selected
value opens.
Upon first entering the Graph view for a logged value,
all
available samples are displayed. The X axis (sample
time) ranges from the time and date of the earliest avail-
able sample relative to the time and date of the latest sam-
ple. The Y axis (sample value) ranges
from the minimum
sensor reading to the maximum sensor reading.
In the case of an input point log, (e.g., suction pres-
sure) assume the Log Group setup specifies Samples as
10
00 and Log Interval as 0:03:00. Also assume that the
system has been running continuously with no interrup-
tions for one week. The X axis would
span a time interval
starting approximately six days and six hours ago all the
way up to the present.
If suction pressure ranged from
18 psi to 25 psi during
the time period of the log, the Y axis of the graph would be
just large enough to show all samples in the log.
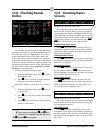
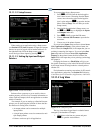
12.11.4 Zooming In and Out
For a more detailed view of a graph, zoom in by press-
ing . Th
is results in half of the samples of the current
view being redrawn to fill the entire view. Using the above
example, the graph would now shows three days and three
hours of samples from the middle of the original graph.
Pressing again zooms in even farther.
Pressing zo
oms out, resulting in a graph whose
time scale spans twice that of the previous view. This dou-
bles the number of displayed samples.
Navigating a Zoomed View
While zoomed in on a graph, only a subset of the total
number of samples
are visible. To view samples that were
recorded earlier or later than those in the current view,
press the left and right cursor keys. The availability of ear-
lier or later samples is indicated by the presence of arrows
at either end of
the X (time) axis.
12.12 Naming Conventions
for E2 Controllers,
Applications, and Points
• Do not name applications, controllers, or points
with all numeric characters.
• Do not use colons (:) in the names of applications,
con
trollers, or points.


