


User Manual MON20/20 Software for Gas Chromatographs
3-9000-745 SEPTEMBER 2010
5-46
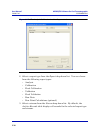
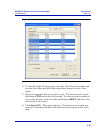
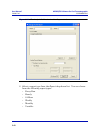
4. To print a report at a fixed interval, check the appropriate checkbox
from the Print At Fixed Interval? column.
(a.) Enter a start time in the Start Time column.
(b.) Enter an interval, in hours, in the Interval column.
5. Use the columns numbered 1 through 20 to select the streams that
you want to use for data collection.
6. To save the changes without closing the window, click Save. To save
the changes and close the window, click OK.
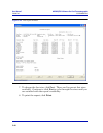
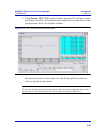
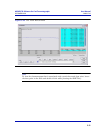
5.8 Viewing trend data
This function allows you to view, print, or save graphical representations,
or trend lines, of accumulated analysis data from the GC.
5.8.1 Viewing live trend data
Note
You cannot view a live trend if the corresponding analysis record does not exist in the
GC’s memory.
To view live trend data, do the following:
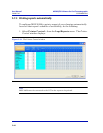
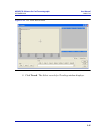
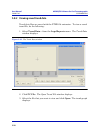
1. Select Trend Data... from the Logs/Reports menu. The Trend Data
window displays.