


User Manual MON20/20 Software for Gas Chromatographs
3-9000-745 OCTOBER 2010
2-18
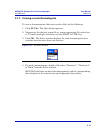
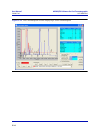
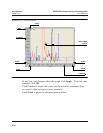
Figure 2-14. A chromatogram
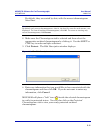
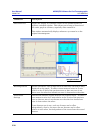
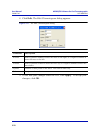
To see how your changes affect the graph, click Apply. To accept your
changes, click OK.
• Click Cursor to toggle the cursor size from coarse movement (less
accurate) to fine movement (more accurate).
• Click Print to print the chromatogram window.
Y axis
X axis
Y Min
Y Max
X max
X Min
X interval
Y interval
color-coded
traces