


User Manual MON20/20 Software for Gas Chromatographs
3-9000-745 SEPTEMBER 2010
5-54
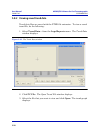
5.10 Editing the display properties of the graph
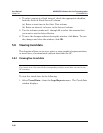
5.10.1 The graph bar
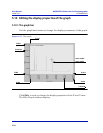
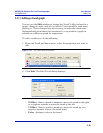
Use the graph bar buttons to change the display parameters of the graph.
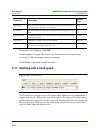
Figure 5-37. The graph
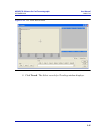
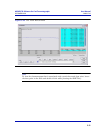
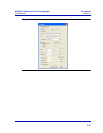
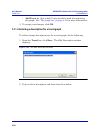
Click Edit to view or change the display properties of the X and Y axes.
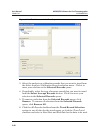
The Edit Graph window displays.
Y axis
X axisY Min
Y Max
X max
X Min
X interval
Y interval
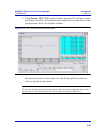
color-coded
trend graph