


User Manual MON20/20 Software for Gas Chromatographs
3-9000-745 SEPTEMBER 2010
5-56
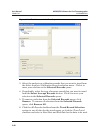
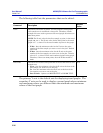
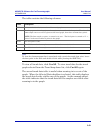
The following table lists the parameters that can be edited:
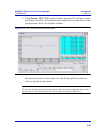
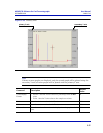
The primary Y axis is the default axis for displaying trend graphs. The
secondary Y axis can be used to display a second graph whose minimum
and maximum values are different than the minimum and maximum
values of the first graph.
Command Description
Default
Value
Point Sets the X-axis values to points. For the purposes of this graph,
each sample run is considered a data point. Therefore, if 2500
sample runs were used to generate the trend graph, then there are
2500 data points.
NOTE: The X-axis value for the first sample, or point, in the trend
graph is 0, not 1. The X-axis value for the final point in the trend
graph is N - 1, where N is the total number of points in the graph.
• X Min - Sets the minimum value for the X axis to the point
number of the first sample you want to use in the plot. Default
value is 0.
• X Max - Sets the maximum value for the X axis to the point
number of the last sample you want to use in the plot. Default
value is N - 1, where N is the total number of points in the graph.
Therefore, if there are 2500 points, then the X Max would be
2499.
0
Date Time Sets the X-axis values to the particular GC dates and times of each
sample runs.
• From - Sets the minimum value for the X axis to the date of the
first sample you want to use in the plot.
• To - Sets the maximum value for the X axis to the date of the
last sample you want to use in the plot.
• Date Format - Options are MM-DD-YYYY or DD-MM-YYYY.
N/A