


User Manual MON20/20 Software for Gas Chromatographs
3-9000-745 SEPTEMBER 2010
5-58
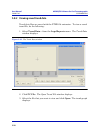
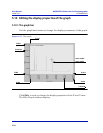
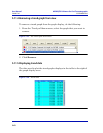
To accept your changes, click OK.
Click Cursor to toggle the cursor size from coarse movement (less
accurate) to fine movement (more accurate).
Click Print to print the graph window.
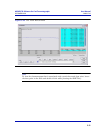
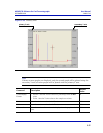
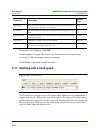
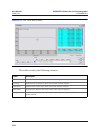
5.11 Working with a trend graph
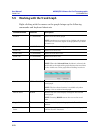
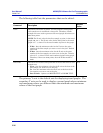
Figure 5-40. The Trend bar
The Trend bar contains a row of buttons that allows you to manipulate a
single trend trace. Below the row of buttons is the trace pull-down menu,
which contains a list of all of the currently displayed traces that make up
the trend graph. Before you can work with a trend trace you must first
select it from the pull-down menu.
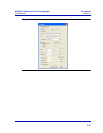
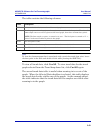
Print Speed Sets the number of inches per second for the x-axis while printing a
chromatogram, similar to an XY plotter.
N/A
X Intervals Sets the number of intervals to be displayed on the graph for the X
axis.
10
Display Option Determines whether the chromatograph is displayed as a solid line
or as a dotted line.
Lines
Show labels Determines whether each axis is labelled. Checked
Scroll newest X Determined whether the graph’s window moves to focus on the
most recent data point along the x axis.
Checked
Command Description
Default
Value