


MON20/20 Software for Gas Chromatographs User Manual
SEPTEMBER 2010 3-9000-745
5-63
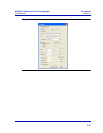
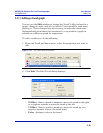
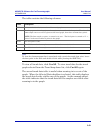
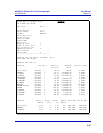
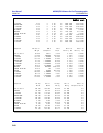
The table contains the following columns:
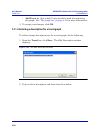
Note
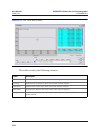
To view the chromatogram that is associated with a particular trend data point, locate
the data point in the table and double-click it while pressing the SHIFT key.
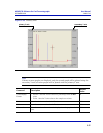
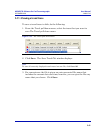
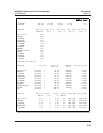
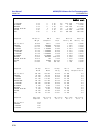
To view all trend data, click Cur/All. To view trend data for the trend
graph selected from the Trend drop-down list, click Cur/All again.
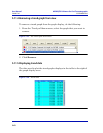
The second trend data table is useful when zooming in to or out of the
graph. When the Selected Data checkbox is selected, this table displays
the trend data for the visible area of the graph. As the example shows,
the table indicates that the trend data for five samples are visible after
zooming in to the graph.
Label Description
TRD Indicates the identifcation number of the trend graph.
Pt # For the purposes of trend graphs, each sample run is considered a data point. Therefore, if
2500 sample runs were used to generate the trend graph, then there are 2500 data points.
NOTE: The first sample, or point, is counted as 0, not 1. The final point is counted as N - 1,
where N is the total number of points in the graph.
Value The data point’s value.
Data The GC’s date when the sample was run and the value was calculated.
Time The GC’s time when the sample was run and the value was calculated.