


Intel
®
IXP400 Software
Programmer’s Guide IXP400 Software Version 2.0 April 2005
Document Number: 252539, Revision: 007 247
Access-Layer Components:
Performance Profiling (IxPerfProfAcc)
API 17
This chapter describes the Intel
®
IXP400 Software v2.0’s “Performance Profiling API” access-
layer component.
17.1 What’s New
There are no changes or enhancements to this component in software release 2.0.
However, the Internal Bus PMU registers on the IXP46X network processors are not identical to
the Internal Bus PMU registers on the IXP42X product line processors. The IxPerfProfAcc
component has not be modified to accomodate the IXP46X network processors Internal Bus PMU
registers.
The component detects the IXP46X network processors and returns an error when Bus PMU or
Intel XScale core PMU functions are requested. The XCycle utility will operate on both IXP42X
product line processors and IXP46X network processors.
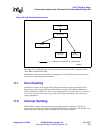
17.2 Overview
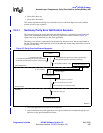
The PerfProf Access module (IxPerfProfAcc) provides client access to the available performance
statistics from the Intel XScale core’s PMU and the Internal Bus PMU as well as Xcycle, the idle-
cycle counter utilities. These PMUs consist of programmable event counters, event select registers,
and previous master/slave registers. Each counter is associated with an event by programming the
event select registers.
The different features (Intel XScale core PMU, Bus PMU, and Xcycle) are not to be run at the
same time as the PMU-enabling software may use a significant portion of the resources. In
addition, the PMU-enabling software runs as an interrupt service routine while Xcycle disables
interrupt during startup.
Utilizing only one PMU at a time will minimize the impact of the PerfProf Access module.
Furthermore, the specific tasks for each PMU are not to be run in parallel. The PerfProf access
layer component reads the registers for counter values, does the relevant calculations and presents
the results to the client. All event and clock counters managed by the PerfProf access module are
split into two, 32-bit-wide counters, to represent the upper and lower 32 bits of the count.
The access layer component itself will not contain any printf functions. Errors will be handled
through error logging, but will store the calculated values in pointers to the output parameters —
which can be accessed by the calling client. For the Event and Time sampling features of the Intel
XScale core PMU, the results will also be printed to an output file.