


Intel
®
IXP400 Software
Access-Layer Components: Performance Profiling (IxPerfProfAcc) API
April 2005 IXP400 Software Version 2.0 Programmer’s Guide
248 Document Number: 252539, Revision: 007
17.3 Intel XScale
®
Core PMU
The purpose of the Intel XScale core PMU is to enable performance measurement and to allow the
client to identify the “hot spots” of a program. These hot spots are the sections of a program that
consume the most number of cycles or cause process stalls due to events like cache misses,
branches, and branch mispredictions.
The Intel XScale core PMU capabilities include clock counting, event counting, time-based
sampling, and event-based sampling. A profiling period is defined as the length of time throughout
which counting or sampling is done for a section of code. The results of this period are a profile
summary.
Clock counting is used to measure the execution time of a program. The execution time of a block
of code is measured by counting the number of processor clock cycles taken.
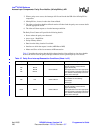
Event counting will be used to measure the number of specified performance events that occur in
the system during the profiling period. The events monitored by the Intel XScale core’s PMU are:
• Instruction cache miss requires fetch from external memory
• Instruction cache cannot deliver an instruction
This could indicate an ICache miss or an ITLB miss. This event will occur every cycle in
which the condition is present
• Stall due to a data dependency. This event will occur every cycle in which the condition is
present
• Instruction TLB miss
• Data TLB miss
• Branch instruction executed, branch may or may not have changed program flow
• Branch mispredicted (B and BL instructions only)
• Instruction executed
• Stall because the data cache buffers are full (This event will occur every cycle in which the
condition is present.)
• Stall because the data cache buffers are full (This event will occur once for each contiguous
sequence of this type of stall.)
• Data cache access, not including cache operations
• Data cache miss, not including cache operations
• Data cache write-back (This event occurs once for each half line (four words) that are written
back from the cache.)
• Software changed the PC
This event occurs any time the PC is changed by software and there is not a mode change. For
example, a MOV instruction with PC as the destination will trigger this event. Executing a
SWI from Client mode will not trigger this event, because it will incur a mode change.
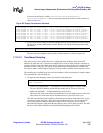
Time-based sampling is used to identify the most frequently executed lines of code for the client to
focus performance analysis on. In this method, the sampling rate is the number of processor clock
counts before a counter overflow interrupt is generated, at which a sample is taken. This sampling
rate is defined by the client. The number of occurrences of each PC value determines the frequency
with which the Intel XScale core’s code is being executed.