


Intel
®
IXP400 Software
Access-Layer Components: Performance Profiling (IxPerfProfAcc) API
Programmer’s Guide IXP400 Software Version 2.0 April 2005
Document Number: 252539, Revision: 007 253
17.10.1 API Usage for Intel XScale
®
Core PMU
The Intel XScale core’s PMU utility provides three different capabilities, namely, event/clock
counting, time-based sampling, and event-based sampling. The user may monitor their code/
program in two ways:
• From the CLI, call the appropriate Intel XScale core’s PMU utility
• In the user’s code itself, insert the appropriate Intel XScale core’s PMU utility’s start and stop
functions.
17.10.1.1 Event and Clock Counting
This utility can be used to monitor clock counting and event counting in Intel XScale core’s PMU.
It tells the user how many processor cycles are taken and how many times an event has occurred.
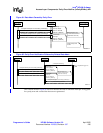
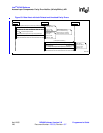
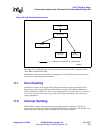
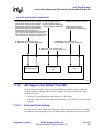
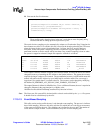
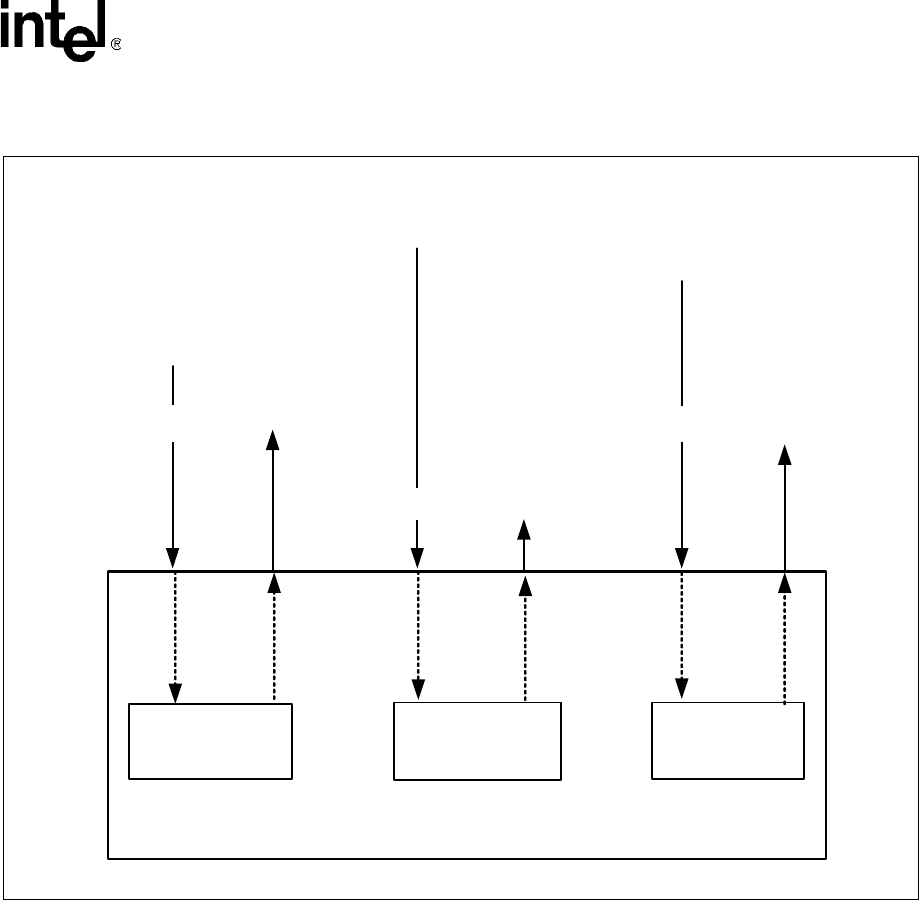
Figure 85. IxPerfProfAcc Component API
Intel XScale
®
PMU
Internal Bus
PMU
Xcycle
B2400-02
ixPerfProfAccXscalePmuEventCountStart() ixPerfProfAccBusPmuStart () ixPerfProfAccXcycleBaselineRun()
ixPerfProfAccXscalePmuEventCountStop() ixPerfProfAccBusPmuStop()
ixPerfProfAccXscalePmuTimeSampStart() ixPerfProfAccBusPmuResultGet()
ixPerfProfAccXscalePmuTimeSampStop() ixPerfProfAccBusPmuPMSRGet() ixPerfProfAccXcycleStart()
ixPerfProfAccXscalePmuEventSampStart() ixPerfProfAccXcycleStop()
ixPerfProfAccXscalePmuEventSampStop() ixPerfProfAccXcycleResultsGet ()
ixPerfProfAccXscalePmuResultsGet ()
ixPerfProfAccXscalePmuTimeSampCreateProcFile()
- Linux only (Only to be called by /proc filesystem)
ixPerfProfAccXscalePmuEventSampCreateProcFile()
- Linux only (Only to be called by /proc filesystem)
IX_PERFPROF_ACC_STATUS_FAIL IX_PERFPROF_ACC_STATUS_FAIL
IX_PERFPROF_ACC_STATUS_SUCCESS IX_PERFPROF_ACC_STATUS_SUCCESS
IX_PERFPROF_ACC_STATUS_FAIL
IX_PERFPROF_ACC_STATUS_SUCCESS