


Intel
®
IXP400 Software
Access-Layer Components: Performance Profiling (IxPerfProfAcc) API
Programmer’s Guide IXP400 Software Version 2.0 April 2005
Document Number: 252539, Revision: 007 249
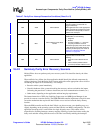
Event-based sampling will allow the client to identify the “hot spots” of the program for further
optimization. In this method, the sampling rate is the number of events before a counter overflow
interrupt is generated. This sampling rate is defined by the client. As in time-based sampling, the
PC value of each sample and frequency will be determined. This allows the client to identify the
sections of code that cause each event.
Time-based sampling and event-based sampling, and event counting must not be performed
concurrently. The client should be aware of the data memory required to perform each of these
operations.
Event-based sampling allows the client to sample up to four events at a time. The maximum data
memory required to store the results, in the event that the client chooses to perform event-based
sampling with four events simultaneously, is about 4 Mbytes, and about 1 Mbytes for time-based
sampling. In the event of an overflow in the results buffer, the client will be notified.
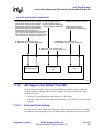
The PerfProf module provides the client with APIs to start and stop the collections of events. It will
provide an API that reads and stores the value of all the counters. It will also enable the client to
measure the latency (in clock cycles) between any two Intel XScale core instructions in a program.
Furthermore, the module will allow the client to determine the frequency with which Intel XScale
core code is being executed.
17.3.1 Counter Buffer Overflow
The PerfProf module will allow the client to count up to four different events simultaneously and
will also handle the overflow of these counters. In the case of overflow, the module will need to
register an interrupt service routine. However, the handling of overflow will have a minimal impact
on the running system.
The program shall keep track of the number of times a buffer has over flowed. The necessary
adjustments will then be made to the final count value, to ensure an accurate value.
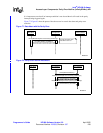
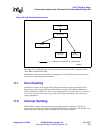
17.4 Internal Bus PMU
The internal bus PMU enables performance management of components accessing or utilizing the
north and south bus. This includes statistics of the bus itself.
The counters monitor two types of events, which are occurrence events and duration events. The
occurrence event causes the counter to increase by one, each time the event occurs. For duration
events, the counter counts the number of clocks during which a particular condition or a set of
conditions is true.
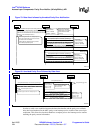
This PMU is able to monitor and gather statistics on SDRAM, north bus, south bus, north masters,
north slaves, south masters, south slaves, and miscellaneous items like the cycle count. Among the
details being monitored are:
• North bus usage — The north bus occupancy reported by the PMU.
This is done by taking a snapshot of the total cycle count and subtracting the idle time.
• South bus usage — The south bus occupancy reported by the PMU.
This is done by taking a snapshot of the total cycle count and subtracting the idle time.