


Intel
®
IXP400 Software
Access-Layer Components: Performance Profiling (IxPerfProfAcc) API
Programmer’s Guide IXP400 Software Version 2.0 April 2005
Document Number: 252539, Revision: 007 257
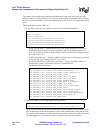
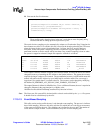
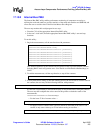
iii. Print out the first five elements:
These profile results show the places in the user’s code that are most frequently being
executed and that are taking up the most processor cycles.
The results for time sampling are also automatically written to a file when the “Stop” functions for
these features are called. For vxWorks, this file is stored in the location pointed by the FTP server
where the image for the system is downloaded from. In Linux, the file is stored in the /proc
filesystem. As this filesystem is temporary, the user is required to copy the output file into a
permanent location or else the results will be lost when a new round of sampling is done or when
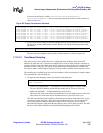
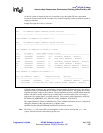
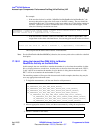
the system is stopped or rebooted. Sample file output for vxWorks is as follows:
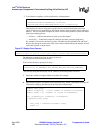
Linux output is identical with the exception of the Percent column. In Linux, the user is also able to
change the accuracy of matching the PC Address to the Symbol Address. The greater the accuracy
required, the longer it takes to find a match. The recommended accuracy is 0xffff which means the
module will reduce the PC Address by up to 0xffff until it can find a match. Else, a message is
logged and “No symbol found” is written to the file. The accuracy can be changed by modifying
the #define IX_PERFPROF_ACC_XSCALE_PMU_SYMBOL_ACCURACY.
The output filename is defined in IxPerfProfAcc. To use a different filename, the user is required to
change the filename in the stop function for vxWorks or the
ixPerfProfAccXscalePmuTimeSampCreateProcFile() function in Linux.
Note: The Linux proc file create API is declared public so that it can be called by the /proc file system.
It should never be called directly by the user.
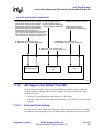
17.10.1.3 Event-Based Sampling
This utility can be used to profile the user’s code through event sampling. The process is similar to
that of time sampling. However, this utility tells the user which lines of codes trigger occurrences
of the events specified by the user. The sampling rate is defined by the user and is the number of
events before a sample is taken. Each event defined, may have its own sampling rate.
for (i=0; i++; i<5)
{
printf("timeprofile element %d pc value = 0x%x\n", i,
timeProfile[i].programCounter);
printf("timeprofile element %d freq value = %d\n", i,
timeProfile[i].freq);
}
Hits Percent PC Address Symbol Address Offset ClosestRoutine
------- --------- ------------- ------------------ -------- -------------------
65451 99.8718 49a88 49914 174 reschedule
14 0.0214 47938 47924 14 intUnlock
10 0.0153 49a84 49914 170 reschedule
10 0.0153 49a8c 49914 178 reschedule
1 0.0015 54ab8 54ab8 0 __div32