


Intel
®
IXP400 Software
Access-Layer Components: Performance Profiling (IxPerfProfAcc) API
April 2005 IXP400 Software Version 2.0 Programmer’s Guide
258 Document Number: 252539, Revision: 007
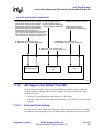
The steps needed to run this utility are:
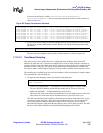
1. To begin the event sampling, call the start function with parameters:
This function starts the event-based sampling to determine the frequency with which events
are being executed. The sampling rate is the number of events, as specified by the user, before
a counter overflow interrupt is generated.
A sample is taken at each counter overflow interrupt. At each sample,the value of the program
counter determines the corresponding location in the code. Each of these occurrences are
recorded to determine the frequency with which the Intel XScale core’s code in each event is
executed.
This API has to be called before ixPerfProfAccXscalePmuEventSampStop can be called.
— UINT32 [in] <numEvents> — The number of PMU events that are to be monitored as
specified by the user. The value should be between 1-4 events at a time.
— IxPerfProfAccXscalePmuEvent [in] pmuEvent1 — The specific PMU event to be
monitored by counter 1
— UINT32 [in] eventRate1, eventRate2, eventRate3, eventRate4 — The number of events
before a sample taken. If 0 is specified, the full counter value (0xFFFFFFFF) is used. The
rate must not be greater than the full counter value.
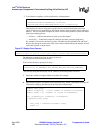
2. To end the event sampling, call the stop function, with parameters:
It is the user’s responsibility to allocate the memory for the pointers before calling this
function. The user may then read/print the values stored in these pointers to obtain the results
of the event sampling process. The user may obtain the number of samples for each event
counter by calling the function ixPerfProfAccXscalePmuResultsGet(). The results are
presented to the calling function in a sorted form from the PC address with the highest
frequency to the PC address with the lowest frequency of hits.
The event profiles will show the user the parts of the code that cause the specified events to
occur.
The results for event sampling are also automatically written to a file when the “Stop” functions for
these features are called. For vxWorks, this file is stored in the location pointed by the FTP server
where the image for the system is downloaded from. In Linux, the file is stored in the /proc file
system.
ixPerfProfAccXscalePmuEventSampStart(
UINT32 numEvents,
IxPerfProfAccXscalePmuEvent pmuEvent1, UINT32 eventRate1,
IxPerfProfAccXscalePmuEvent pmuEvent2, UINT32 eventRate2,
IxPerfProfAccXscalePmuEvent pmuEvent3, UINT32 eventRate3,
IxPerfProfAccXscalePmuEvent pmuEvent4, UINT32 eventRate4)
ixPerfProfAccXscalePmuEventSampStop(
IxPerfProfAccXscalePmuSamplePcProfile *eventProfile1,
IxPerfProfAccXscalePmuSamplePcProfile *eventProfile2,
IxPerfProfAccXscalePmuSamplePcProfile *eventProfile3,
IxPerfProfAccXscalePmuSamplePcProfile *eventProfile4)