


Intel
®
IXP400 Software
Access-Layer Components: Performance Profiling (IxPerfProfAcc) API
April 2005 IXP400 Software Version 2.0 Programmer’s Guide
260 Document Number: 252539, Revision: 007
17.10.1.4 Using Intel XScale
®
Core PMU to Determine Cache Efficiency
In this example, the user would like to monitor the instruction cache efficiency mode. The user
would use the event counting process to count the total number of instructions that were executed
and instruction cache misses requiring fetch requests to external memory.
The remaining two counters will not provide relevant results in this example. The counters may be
set to the appropriate default event value.
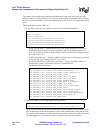
1. To begin the counting, call the start function, with parameters:
2. Declare a results variable:
3. To end the counting, call the stop function, with parameters:
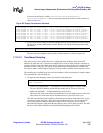
4. Print the total value (combining the upper and lower 32 bits) of all the counters:
Note: As only event counters one and two were configured to monitor events, the results of
event counters 3 and 4 will remain at zero and will be irrelevant.
5. The appropriate statistics can be calculated from the results to determine the instruction cache
efficiency. The instruction cache miss rate is the instruction cache misses (monitored by event
counter two) divided by the total number of instructions executed (monitored by event counter
one):
Instruction cache miss rate
— =instruction cache misses/total number of instructions executed
— = total event count 2 / total event count 1
6. The average number of cycles it took to execute an instruction (also known as cycles-per-
instruction), is the total clock count (monitored by the clock counter) divided by the total
number of instructions executed (monitored by event counter 1):
ixPerfProfAccXscalePmuEventCounting (FALSE, 2,
IX_PERFPROF_ACC_XSCALE_PMU_EVENT_INST_EXEC,
IX_PERFPROF_ACC_XSCALE_PMU_EVENT_CACHE_MISS,
IX_PERFPROF_ACC_XSCALE_PMU_EVENT_MAX,
IX_PERFPROF_ACC_XSCALE_PMU_EVENT_MAX)
IxPerfProfAccXscalePmuResults results;
ixPerfProfAccXscalePmuEventCountStop (
IxPerfProfAccXscalePmuResults &results)
printf(“total clk count = 0x%x%x\n”, results.clk_samples, results.clk_value);
printf(“total event 1 count = 0x%x%x\n”, results.event1_samples, results.event1_value);
printf(“total event 2 count = 0x%x%x\n”, results.event2_samples, results.event2_value);
printf(“total event 3 count = 0x%x%x\n”, results.event3_samples, results.event3_value);
printf(“total event 4 count = 0x%x%x\n”, results.event4_samples, results.event4_value);
cycles-per-instruction = total clock count / total number of instructions executed
= total clk count / total event count 1