Intel
®
IXP400 Software
Access-Layer Components: Performance Profiling (IxPerfProfAcc) API
April 2005 IXP400 Software Version 2.0 Programmer’s Guide
250 Document Number: 252539, Revision: 007
• SDRAM controller usage — Usage monitored in all eight pages of the SDRAM, i.e., the pages
used and how often they are used.
This also includes percentage usage and number of hits per second.
• SDRAM controller miss percentage — Identifies number of misses and rate of misses when
accessing the SDRAM. A high miss rate would indicate a slow system.
• Previous Master Slave — Identifies the last master and slave on the respective buses.
This module has a Start API that obtains the register values at regular intervals. It only stops when
a Stop API is called. User gets the desired results from the Get API.
17.5 Idle-Cycle Counter Utilities (‘Xcycle’)
The idle-cycle counter utilities (called “Xcycle,” in this document) calculate the percentage of
cycles that have been idle (not performing any processing) for a period of time.
The client needs to calibrate the program by running ixPerfProfAccXcycleBaselineRun() when
system is under low utilization. The client then starts the program it wants to measure. The
ixPerfProfAccXcycleStart() API kicks off the idle cycle measurements. The client can select
continuous Xcycle calculations, in which case calculations are stopped by calling the
ixPerfProfAccXcycleStop(). Otherwise, the Xcycle measurements will occur for the number of
times specified and will stop automatically.
The ixPerfProfAccXcycleResultsGet() API will calculate and prepare all the results to be sent to the
calling function. The result contains maximum percentage of idle cycles, minimum percentage of
idle cycles, average percentage of idle cycles, and total number of measurement made.
17.6 Dependencies
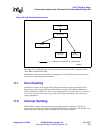
Figure 84 shows the functional dependencies of the IxPerfProfAcc component.


