


Intel
®
IXP400 Software
Access-Layer Components: Performance Profiling (IxPerfProfAcc) API
Programmer’s Guide IXP400 Software Version 2.0 April 2005
Document Number: 252539, Revision: 007 255
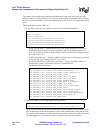
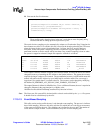
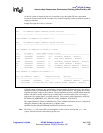
If the user has declared a variable IxPerfProfAccXscalePmuResults
eventCountStopResults, the user may then print out the result for all the counters as
shown in Figure 86.
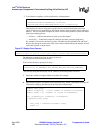
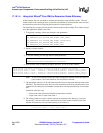
3. If at any time before, during, or after the counting process, the user wishes to view the value of
all four event counters and the clock counter, the user may call the following function with
parameters:
The user may then read/print out the results of all the counters, as shown in Figure 86.
17.10.1.2 Time-Based Sampling
This utility can be used to profile the user’s code through time sampling, which records PC
addresses at fixed intervals. It tells the user which lines of code are most frequently executed, by
creating a profile of the code which shows the PC addresses in the code that were sampled and the
frequency of their occurrence. The results are presented to the calling function in a sorted form
from the pc address with the highest frequency to the pc address with the lowest frequency of hits.
The sampling rate is defined by the user and is the number of clock counts before a sample is taken.
The steps needed to run this utility are:
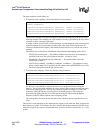
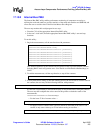
1. To begin the time sampling, call the start function with parameters:
— UINT32 [in] samplingRate — The number of clock counts before a sample is taken.
The rate specified cannot be greater than the counter size of 32 bits or set to zero.
— BOOL [in] clkCntDiv — Enables/disables the clock divider.
When true, the clock count will be incremented by one at each 64th processor clock cycle.
When false, the clock count will be incremented at every processor clock cycle.
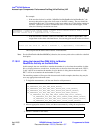
This API starts the time based sampling to determine the frequency with which lines of code
are being executed. Sampling is done at the rate specified by the user. At each sample, the
value of the program counter is determined. Each of these occurrences are recorded to
determine the frequency with which the Intel XScale core’s code is being executed. This API
has to be called before ixPerfProfAccXscalePmuTimeSampStop can be called.
Figure 86. Display Performance Counters
printf("Lower 32 bits of clock count = %u\n", eventCountStopResults.clk_value);
printf("Upper 32 bits of clock count = %u\n", eventCountStopResults.clk_samples);
printf("Lower 32 bits of event 1 count = %u\n", eventCountStopResults.event1_value);
printf("Upper 32 bits of event 1 count = %u\n", eventCountStopResults.event1_samples);
printf("Lower 32 bits of event 2 count = %u\n", eventCountStopResults.event2_value);
printf("Upper 32 bits of event 2 count = %u\n", eventCountStopResults.event2_samples);
printf("Lower 32 bits of event 3 count = %u\n", eventCountStopResults.event3_value);
printf("Upper 32 bits of event 3 count = %u\n", eventCountStopResults.event3_samples);
printf("Lower 32 bits of event 4 count = %u\n", eventCountStopResults.event4_value);
printf("Upper 32 bits of event 4 count = %u\n", eventCountStopResults.event4_samples);
ixPerfProfAccXscalePmuResultsGet(IxPerfProfAccXscalePmuResults *results)
ixPerfProfAccXscalePmuTimeSampStart(UINT32 samplingRate,
BOOL clkCntDiv)