


494A/494AP
Servlce Vol.
1
Figure
page
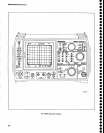
The 494AP
Spectrum
Analyzer.
...................
xvi
2-1 Dimensions.
....,....,..2-12
3-1 Location
of input
power
selector
switch
and fine
fuse.
.._.......
.....,..,.........9-2
4-1 Crt
display at
initial
power-up.
......................
4-4
4-2 Typical
display of
catibrator
signal
in Max
SpanlDiv.
...............................
4-5
4-3
Test
equipment
setup
lor
checking
center
frequency
accuracy.
....... 4-g
44
Center frequency
drift with
the
1st
LO
tocked.
....................4-9
4-5
Typical
display
for
measuring
residual
FM. ............
..................4-10
4-6 Typical
marker
display for
measuring
Span/Div
accuracy.
.....................
4-1 1
4-7 Test
equipment
setup for
checking
frequency
Span/Div and
sweep
Time/Div
accuracy.
....................
4-13
4-8
Typical
display
for
measuring
Time/Div
accuracy.
....................
4-14
4-9 Typical
display
for
measuring
bandwidth and
shape
factor.
.....4-14
4-10
Typical
display
for
measuring
noise sidebands.
...........
............ 4-15
4-1'l
Test
equipment
s€tup tor
measuring
0.01
GHz to 21
GHz
frequency
response.
..................
4-17
4-12 Test equipment
setup
for
measuring
10
kHz
to
l0
MHz
frequency
response.
..................
4-19
4-13 Test
equipment
setup for
checking
dynamic range
and accuracy,
and
preselector
rejection.
................
4-19
4-14 RF
attenuator
test equipm€nt
setup.
............4-21
4-1
5
RF attenuator
test
equipment
setup
lor
50-60
dB step.
.........,.........4-24
4-1 6
.
Test
equipment
setup for checking
intermodulation
distortion
....,,,....4-28
4-17
f
ntermodulation
products
............4-29
4-1
I
Test
equipment
setup
for checking
harmonic
distortion.
..............,...
4-90
4-19 Test equipment
setup
for
checking
1
dB
input
compression point.
..........................,...
4-31
4-20 T€st equipment
setup for
checking
internal
trigger characteristics.
..............
......-
4-92
4-21 External
video
select
pins
and
MARKER
IVIDEO
input.
..........
..
4-30
4-22 Test
equipment
setup for
checking
external
triggering
and horizontal
input
characteristics.
.................
4-33
x
Figure
Page
4-23
Test
oscilloscope
display
of
VERT
output
with a full screen display
on
the
Spectrum
Analyzer.
.......4-34
4-24
Equipment
setup
for checking
Option 07
frequency
response
from
0.01 GHz to 1
GHz.
.......... 4-35
4-25 Equipment
setup for checking
Option
07 frequency response
from
5
MHz
to
10
MHz. ............ 4€6
4-26
Test equipment
setup
for checking
Option 41
Span/Div
accuracy.
..
4-37
4-27 Test equipment
setup
for checking
Option
42 frequency
characteristics.
............
4-38
5-1
Low voltage
power
supply adiustmentsi
..................................... 5-4
5-2
Crt display
adjustment and
test
point
locations. .................. 5-5
5-3
Adjustment and
test
point
locations
on High Voltage
module.
............... 5-6
5-4
Test equiprnent setup
for
adjusting
the Deflection
Amplifier.
................ 5-7
5-5
Test
points
on
the CRT
Readout
board.
.....5-7
5-6
Deflection Amptifier
test
points
and
adjustments. ..........
............
5-8
5-7
Digital storage adjustment
locations.
.........,.... 5-9
5-8
Test
equipment setup
for
adjusting sweep timing.
............ 5-9
5-9
Sweep board timing adjustment
and
test
point
locations.
............................... 5-10
5-10
Frequency
control system test
point
and adjustment
locations.
................... 5-11
5-11
P3035
on
the Video Processor board.
......... 5-12
5-12
Test
equipment setup for
adjusting
the Log Amplifier.
..................... 5-12
5-13
Log and Video Amplifier test
point
and adjustment locations
........... 5-13
5-14
Test equipment
setup for
adjusting
the
Variabl€ Resolution
module. ..........,.......,
5-14
5-1 5
Adjustments
on
the
rear
of the
Variable Resolution
module.
..... 5-15
5-16
100 kHz over 10 kHz
filter
response. ........... 5-16
5-17
Adjustments
on
the
tront
of the
Variable
Resolution
module.
.....
5-18
5-18
Adjustments
on
the 10
Hzl'|00 Hz
Bandpass Filter Assembly.
...........................
5-18
5-19
10
kHz, 100
kHz, and
1 MHz filter
response.
....,.............................
5-1
I
5-20
lF
gain
test
setup, and
adiustment
and connector
locations.
..........
5-21
LIST
OF
ILLUSTRATIONS
I
a
o
o
t
t
a
a
o
o
o
I
o
I
o
t
o
o
o
I
a
a
o
o
o
o
I
o
o
I
I
o
I
O
t
o
a
a
O
o
o
o
o
o