


o
o
o
o
I
o
s
o
)
o
o
o
o
o
I
I
I
t
I
I
I
a
o
o
o
o
o
o
o
t
a
I
a
o
o
a
I
I
o
a
t
a
I
a
23.
Check
Harmonic
Distortion
{-60
dBc
or
tess
frorn
10
kHz
to 1.g
GHz)
{Not discernible
above
tt
"
"u"r"g"
no]r"
ftoor
(at
teast
100
dBc)
from
1.7
GHz
to
21-cHti
Tested
at
-90
dBm
in
MIN
DTSTORTTON
mode
a.
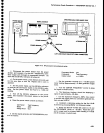
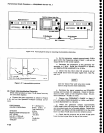
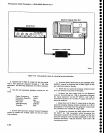
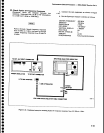
Gonnect
the
test
equipment
as
shown
in
Figure
4-18,
and
set
the
Spectrum-
Analyzer
"onirolu
as
fol_
lows:
Performance
Check
procedure
-
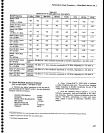
4g4Al4g4Ap
Service
Vd.
l
CenterFrequency
2O72MHz
Span/Div
2MHz
Min
RF Atten
dB
0
Verticat
Display
t0dB/DtV
Time/Div
Auto
Triggering
Free
Run
Baseline
Clip
Otr
Reference
Level
-70
dBm
Auto
Resolution
On
View
A and
View
B
On
Mdeo
Filter
Wide
Peak/Average
Fully
Clockwise
.
b.
Set
the Spectrum
Analyzer
under
test
as foltows:
CENTER
FREQUENCY
0Hz
REF
LEVEL
-30
dBm
SPAN/DIV
100
kHz
.b.
Note
the
Spectrum
Analyzer
display
as
the
gen-
erator
frequency
contror
is
variid
auoui
ilie
center
fre-
quencyof
the
bandpass
filter
if
a
bandpass
filter
is
used
in
the
test,
or
as
the
frequency
is
varied
below
the
cutoff
frequency
if a
low pass
filter
is
used.
Set
the
generator
frequency
at
that
frequency
that
yielded
the
maximum
amplitude
in
part
b, then
set
the output
tevet
for
a
fuil
screen
(_30
Oelny
iign"t.
In
Figure
4-18,
the
filter
shown
must
have
a
minimum
of
40
dB rolloff
to attenuate
multi_
ples
of
the
generator
frequency,
and
the
frequency
ot
the signal
generator
depends
on
the frequency
characteristics
of
the
fitter.
d.
SEt
thE
CENTER
FREQUENCY
tO
!2jlLq$lequency),
FREQ
SPAN/D|V
to 500
kHz,
and
RESOLUTTON
BANDWTDTH
to
10
kHz.
e.
Check
that the
second
harmonic
of
the input
sig_
nal
is at
least
60
dB
below
the
-90
dBm carrier.
f.
SEt
thE
CENTER
FREQUENCY
tO thE
3rd
hAr.
monic.
g,
Check
that
the
third
harmonic
of
the
input
signal
is at
least
60 dB
down from
the
-30
dBm
carrier.
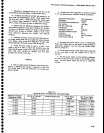
CENTER
FREOUENCY
sPAN/DtV
AUTO
RESOLN
REF
LEVEL
MIN
RF
ATTEN
dB
VERTICAL
OTSPLAY
WIDE
VIDEO
FILTER
MIN
DISTORTION
VIEW
A and
V|EW
B
TrME/DtV
Same
as
Genera-
tor
5 MHz
On
-30
dBm
0
10
dB/Dlv
On
On
On
AUTO
MIN
RF ATTEN
dB
PEAK/AVERAGE
0
Fully
Clockwise
1.7
GHz
100 kHz
On
-30
dBm
0
10
dB/Dtv
On
AUTO
c.
Check for
any
indication
of
LO
emission.
LO
ernission
must
be fess
than
-70
dBm.
25.
Check
1
dB
Compression
point
(-20
dBm Bands
I
through
5)
Calibrate
the
power
meter
befora making
this
measurement.
a.
Use
the
power
meter
to set
the
output
level
of
a
signal
generator
to 0 dBm at
1.7
GHz.
b.
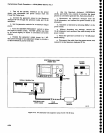
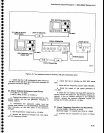
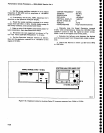
Connect
the
test
equipment
as
shown in
Figure
4-19,
using
th€
generator
with
the
calibrated
output
level.
Set
the
Spectrum Analyzer
controls
as followsi
CENTER
FREOUENCY
sPAN/D1V
AUTO
RESOLN
REF
LEVEL
MIN
RF ATTEN
dB
VERTICAL
DISPLAY
VIEW
A and
VIEW
B
TIME/DrV
24.
Check
LO
Emission
(-70
dBm
or
tess)
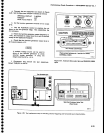
a.
Monitor
the
RF
INPUT
with
a
hioh
spectrum
analyzer
such
as
a
4g2A.
Set tie
trum analyzer
controls
as
follows.
frequency
test
spec-
4-29
c.
Set the attenuators
for
25 dB of
attenuation.