


Performance
Check
procedure
-
4g4Al4g4Ap
Service
Vol.
1
cr
gl.TttB
lm{
iv
ra.l
ta.,
t2.a
a.l
a.a
2-a
t.l
A
C.bubu|g
tbp.
of
|lteon|..
E
-2$el
.a(
t.5:rrq
_2rS/--*
n
la.a
ta.t
t:.t
ra.
a,l
a.a
{.1
2.4
a.l
.T
IM
n
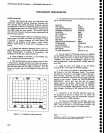
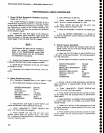
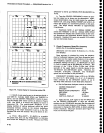
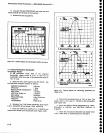
B. Lr.r|dog
Ft
.t
lhc drylato||/dl'rlaloo
ot
urc
roapo||ac.
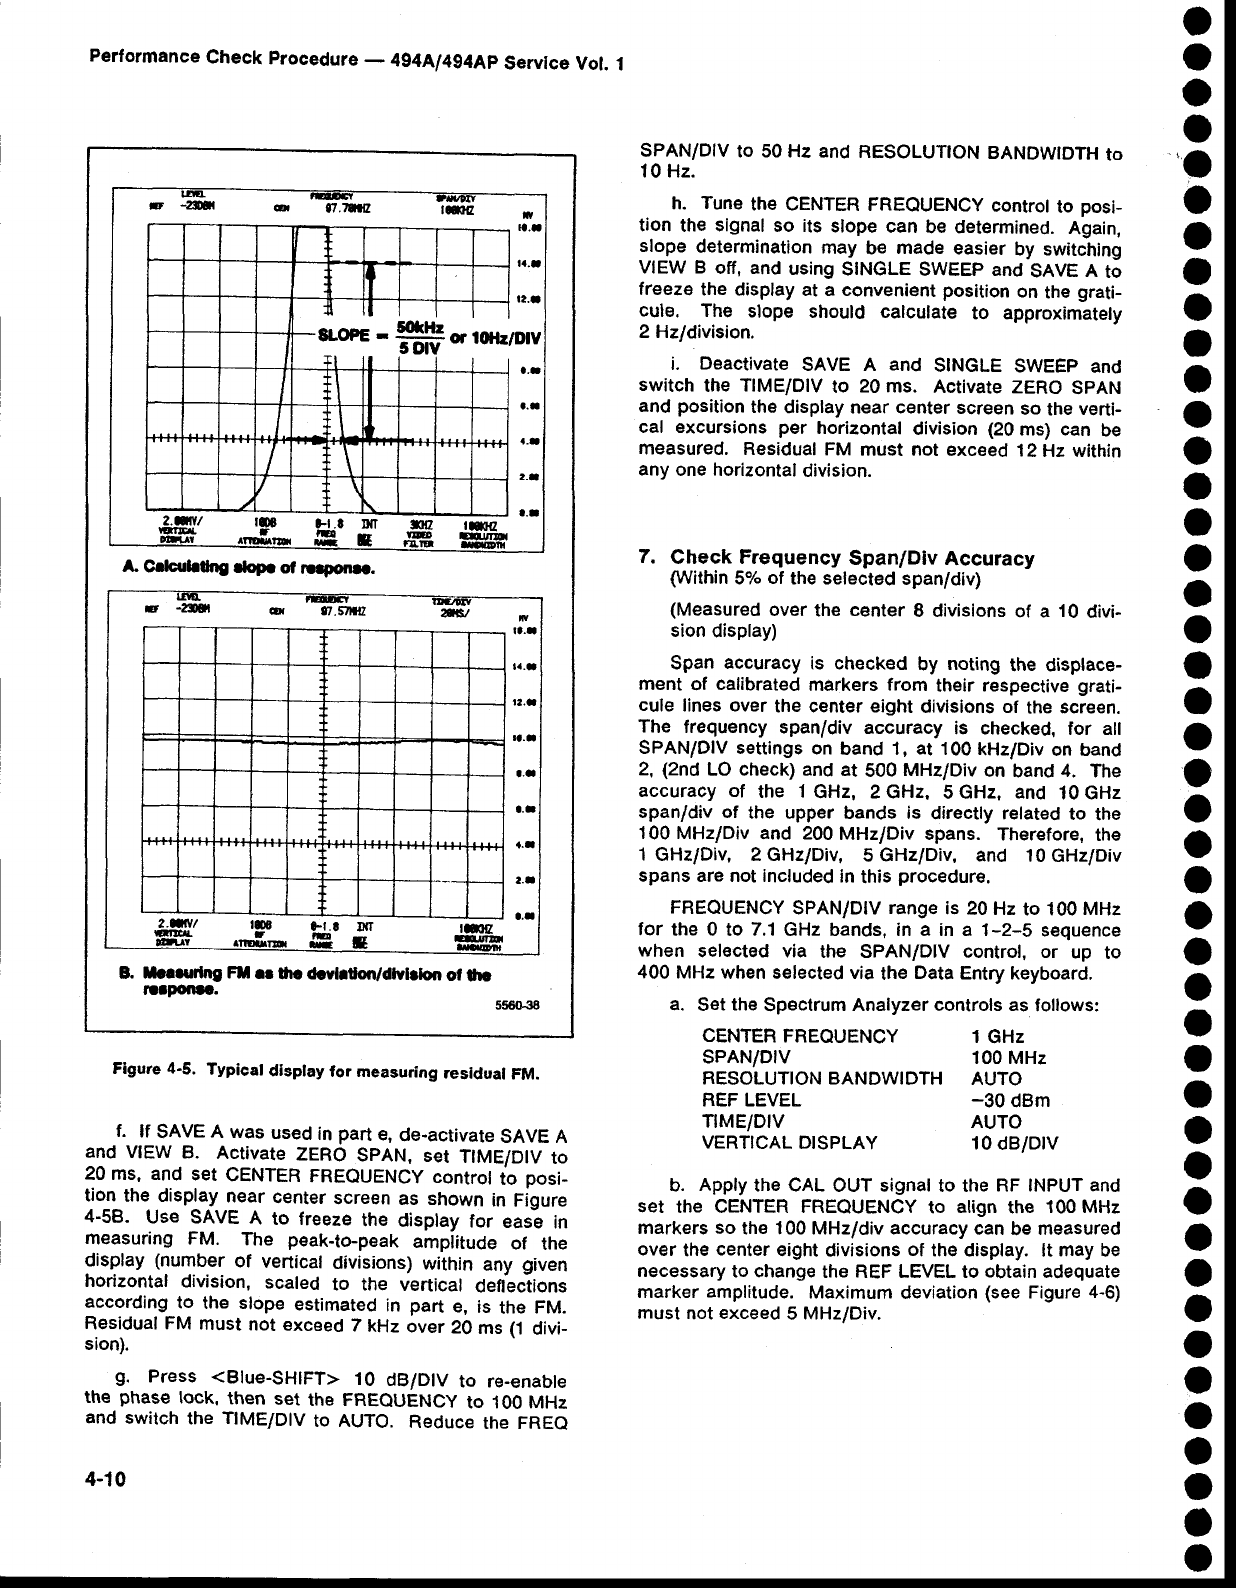
Figure
4-5.
Typical
display
for measuriag
residual
FM.
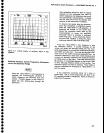
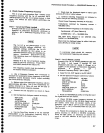
f.
lf
SAVE
A was
used
in
part
e,
de-activate
SAVE A
and
vtEW
B.
Activate
zERo
spAN,
set
TtME/Dlv
to
20 ms, and
set
CENTER
FREQUENCY
controt
to
posi-
tion
the display
near
center
screen
as shown
in Figure
4-58.
Use SAVE
A
to freeze
the
display
for
easl
in
measuring FM.
The
peak-to-peak
amplitude
of
the
display
(number
of
vertical
divisions)
within
any
given
horizontal
division,
scaled
to the
vertical
deflections
according
to
the slope
estimated
in
part
e,
is
the
FM.
Residual FM
must
not exceed
7
kHz
over
20
ms (1
divi_
sion).
S.
Press <Blue-SHIFT>
10
dB/DlV
to re_enable
the
phase
tock,
then
set
the FREQUENCY
to 100 MHz
and
switch
the
TIME/DIV
to AUTO.
Reduce
the FREQ
4-10
SPAN/DIV
to 50 Hz
and RESOLUTTON
BANDWIDTH
to
10 Hz.
h.
Tune
the CENTER
FREQUENCY
controt
to
posi-
tion
the
signal
so its
slope
can
be determined.
Again,
slope
determination
rnay
be
made
easier
by switching
VIEW B
off, and
using
SINGLE
SWEEP and
SAVE
A
to
treeze
the
display at a convenient
position
on
the
grati-
cule.
The
slope
should calculate
to approximately
2 Hzldivision.
i.
Deactivate
SAVE A
and
SINGLE
SWEEP
and
switch
the
TIME/DIV
to
20 ms.
Activate
zERo
spAN
and
position
the
display near center
screen
so
the
verti-
cal excursions
per
horizontal
division
(20
ms) can
be
measured.
Residual
FM
must not
exc€ed
12
Hz within
any
one horizontal
division.
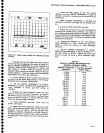
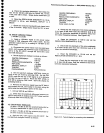
7.
Check Frequency
Span/Div
Accuracy
(Within
5%
of
the selected
span/div)
(Measured
over
the
center
I divisions
of a
10
divi-
sion
display)
Span
accuracy
is checked
by
noting
the displace-
ment
of
calibrated
markers
from
their
respective
grati-
cule
lines over
the center eight
divisions of
the
screen.
The
frequency
span/div
accuracy
is checked,
for all
SPAN/DIV settings
on
band 1,
at
100
kHz/Div
on band
2,
{2nd
LO check) and
at
500
MHz/Div
on
band
4.
The
accuracy of
the
1
GHz, 2 GHz.
5 GHz,
and
10 GHz
spanldiv of
the upper bands is
directly related
to
the
100 MHz/Div
and 200
MHz/Div spans.
Therefore,
the
1
GHzlDiv, 2 GHz/Div,
5
GHz/Div,
and 10
GHz/Div
spans are not included
in
this
procedure.
FREOUENCY
SPAN/DIV
range
is
20 Hz
to 100
MHz
for
the 0
to
7.1
GHz bands, in a in a 1-2-5
s€quence
when
selected via
the SPAN/DIV control, or
up
to
400 MHz
when selected via
the
Data
Entry keyboard.
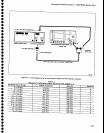
a.
Set
the
Spectrum
Analyzer controls as
follows:
CENTER
FREOUENCY
1
GHz
SPAN/DIV
100 MHz
RESOLUTIONBANDWIDTH
AUTO
REF LEVEL
-30
dBm
T|ME/D|V
AUTO
VERTTCAL
DTSPLAY
10
dB/DtV
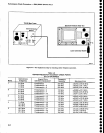
b.
Apply
the CAL
OUT signal to the
RF INPUT and
set
the CENTER FREQUENCY
to
align
the
100 MHz
markers so
the 100 MHz/div accuracy
can
be
measured
over
the
center
eight
divisions
of
the
display. lt
may
be
necessary
to change
the REF LEVEL to
obtain
adequate
marker
amplitude.
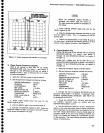
Maximum
deviation
(see
Figure
4-6)
must
not
exceed
5
MHz/Div,
o
o
o
o
a
o
o
a
o
a
o
a
o
a
a
o
o
o
o
a
o
o
o
o
o
o
a
o
o
o
o
o
a
o
o
O
O
a
a
o
O
o
o
o