


9-6
Cisco WAN Manager User’s Guide
Version 10.5, Part Number 78-12945-01 Rev. D0, August 2003
Chapter 9 Summary Report and Wingz Report
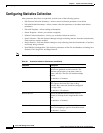
Configuring Summary Reports
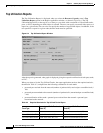
Resource Capacity—Network Report Menu Option
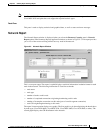
Select this option to display basic node information for all nodes in the network in the Network Report
window. This report provides a view of the resources being utilized at every node in the network.
Resource Capacity—Top Utilization Report Menu Option
Select this option to display the top utilized trunks, ports, or connections for the entire network or a
specified node.
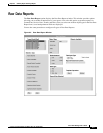
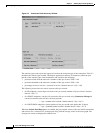
Performance Data—Connection - Connection Traffic Summary Menu Option
Select this option to specify the connection to be plotted and the plot duration through the Connection
Traffic Summary window.
Upon specifying the desired report options and clicking on the Plot button, the total traffic transmitted
and received, as well as, the availability for a selected PVC are displayed in the Report Application
window. Data for both ends of the connection are plotted side by side in this window.
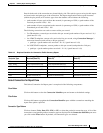
Performance Data—Connection - Connection Traffic Dropped Summary Menu Option
Select this option to specify the connection to be plotted and the plot duration through the Connection
Traffic Dropped window.
Upon specifying the desired report options and clicking on the Plot button, the totals of the dropped
traffic for a selected PVC are displayed in the Report Application window. Data for both ends of the
connection are plotted side by side in this window.
Note The Connection Traffic Dropped Summary menu option is not currently supported for CESM cards.
Performance Data—Trunk -Trunk Traffic Summary Menu Option
Select this option to specify the trunk to be plotted and the plot duration through the Trunk Traffic
Summary window.
Upon specifying the desired report options and clicking on the Plot button, the total traffic transmitted
and received and the unavailability for a selected trunk are displayed in the Report Application window.
Data for both ends of the trunk are plotted side by side.
Note For Cisco MGX 8220 feeder trunks, only the routing node end of the trunks are supported as the
Cisco MGX 8220 end-point does not support the required statistic types.
Performance Data—Port - Port Traffic Summary Menu Option
Select this option to specify the port to be plotted and the plot duration through the Port Traffic Summary
window.
Upon specifying the desired report options and clicking on the Plot button, the total traffic transmitted
and received and the unavailability for a selected port are displayed in the Report Application window.
Data for both ends of the port are plotted side by side.