


9-13
Cisco WAN Manager User’s Guide
Version 10.5, Part Number 78-12945-01 Rev. D0, August 2003
Chapter 9 Summary Report and Wingz Report
Configuring Summary Reports
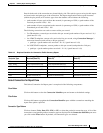
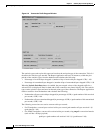
When you select Prev Hour, Prev Day, or Prev Week, the Start Date/Start Time fields are inactive,
and when the Stop Date/Stop Time fields are blank, they are populated with the current date and time.
When you modify the stop date/time, the modified value is used for the plot duration. When you select
TOD, both Start Date/Start Time and Stop Date/End Time fields are activated, and the Stop
Date/End Time fields are populated with the current date and time.
Start Date/Start Time
Specify the starting date and time for the graph in this field.
Stop Date/End Time
Specify the stop date and time for the graph in this field.
Cumulation Period
Click on the appropriate button (Hourly, Daily, or Weekly) to set the report’s plot interval. The default
selection is Hourly.
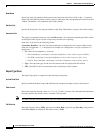
Result Pane
The Result Pane displays status and error messages:
Plot Button
Click on this button to initiate the plotting of the report. The data and graphs are displayed in the Report
Application window.When statistic entries are not found, an error message is displayed in the Result
pane. Otherwise, the Result pane displays the number of entries found.
Cancel Button
Click on this button to cancel the current report filter operation and close this window.
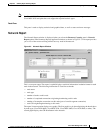
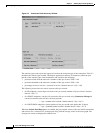
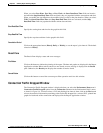
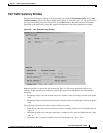
Connection Traffic Dropped Window
The Connection Traffic Dropped window is displayed when you select the Performance Data menu’s
Connection Traffic Dropped option from the Connection submenu in the Performance Data’s menu,
as shown in Figure 9-6. You must select a PVC and plotting time interval, then click on the Plot button
to have the statistical information pertaining to the total traffic dropped for a selected PVC, plotted into
graphs for both ends of the connection and displayed in the Report Application window.