


9-9
Cisco WAN Manager User’s Guide
Version 10.5, Part Number 78-12945-01 Rev. D0, August 2003
Chapter 9 Summary Report and Wingz Report
Configuring Summary Reports
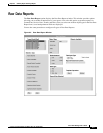
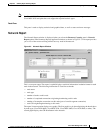
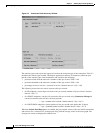
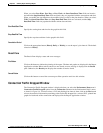
Report Definition Pane
This Report Definition pane is comprised of the following components:
Select Object
Click on the button Connections, Trunks, or Ports to select the object for report generation.
Report Type
Choose either the network wide or node report. The default is network wide.
How many to list
Specify the number of objects to be listed in the report. The default is 10 and the maximum is 50.
Node Name
Specify the node and interface shelf names if the report is for a node only. Click on the “...” button to
display the Node: Shelf Selection window. Select a node name and corresponding shelf name from this
window. This area is inactive if you have selected a network wide report.
Plot Duration
Selections for time of day (TOD), previous hour (Prev Hour), previous day (Prev Day), and previous
week (Prev Week) are displayed. Indicate the Start Date and Stop Date in dd/mm/yy (day/month/year)
format and the Start Time and Stop Time in hh.mm (hour.minute) format.
OK
Choose this button to generate the report.
Cancel
Choose this button to clear all fields and return to the Report Main Window.
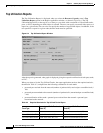
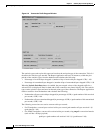
Connection Traffic Summary
The Connection Traffic Summary window is displayed when you select the Performance Data menu’s
Connection Traffic Summary option from the Connection submenu in the Performance Data’s menu,
as shown in Figure 9-5. You must select a PVC and plotting time interval, then click on the Plot button
to have the statistical information pertaining to connection traffic, plotted into graphs for both ends of
the connection and displayed in the Report Application window.