


9-8
Cisco WAN Manager User’s Guide
Version 10.5, Part Number 78-12945-01 Rev. D0, August 2003
Chapter 9 Summary Report and Wingz Report
Configuring Summary Reports
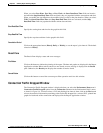
Top Utilization Reports
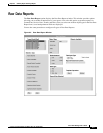
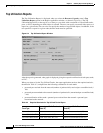
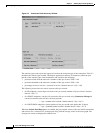
The Top Utilization Reports is displayed when you select the Resource Capacity menu’s Top
Utilization Report option in the Report Application window, as shown in Figure 9-4. The Top
Utilization Report lists as the top 10 (or as many as you select with a maximum of 50) utilized trunks,
ports, or PVCs depending on which object is selected. The user can specify a network wide report or a
report for a given node. The user also can specify the number of top utilized objects. In addition, if the
user specifies a report for a given node, then the node must be specified.
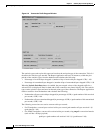
Figure 9-4 Top Utilization Report Window
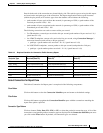
After the report is generated, a bar graph is displayed giving the respective utilization of each port, trunk,
or PVC.
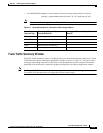
When you select to list the Top Utilized Trunks, the report application retrieves the required statistics,
described in Table 9-2, and performs the following calculations for each trunk:
• percent bytes received from the network (number of packets/cells) received per second/line load) *
100.
• percent bytes transmitted to the network (number of packets/cells) transmitted per second/line load)
* 100.
• percent utilization of the trunk = percent bytes received from the network + percent bytes
transmitted to the network.
Table 9-2 Required Statistics for Top Utilized Trunks Report
Trunk Type
Percentage of Cells Received
(Stats ID)
Percentage of Cells Received
(Stats ID)
Narrow Band — Total packets transmitted (23)
Cisco IGX 8400-ATM Total cells received (38) Total cells transmitted (37)
Cisco BPX 8600-ATM BXM: Total Cells Rx (219 Total cells transmitted to line (52)