


9-21
Cisco WAN Manager User’s Guide
Version 10.5, Part Number 78-12945-01 Rev. D0, August 2003
Chapter 9 Summary Report and Wingz Report
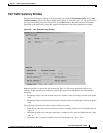
Configuring Summary Reports
Slot.Line
Specify the endpoint’s slot and line number in this field. The default is all slots (the field is blank).
Port List
This region is populated when you select the Filter button. All ports matching the filter criteria are
displayed in this region. You may select a single entry from the list for plotting.
Each entry in the list has the following format:
• Port Identifier—the local and remote endpoints are displayed in this column. The format of the
endpoints is as follows: <nodename>.<slot>.<line>.<port>
• Port Type—the type of the selected port is displayed in this column.
• Port Speed—the port speed for the selected port is displayed in this column.
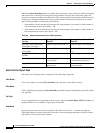
Report Type Pane
The Report Type pane is comprised of the following components:
Include Peak Data
When enabled peak performance is included in the graph along with the average performance data.
Peak Interval Option
Use this to select peak intervals from the values of 1, 5, 6, 10, 12, and 15 minutes if you have enabled
the Include Peak Data button. The default value is 5 minutes (300 seconds).
Note You must select the same peak interval as the one enabled during statistics collection.
Plot Duration
Selections for time of day (TOD), previous hour (Prev Hour), previous day (Prev Day), and previous
week (Prev Week) are displayed. The default value is TOD.
When you select Prev Hour, Prev Day, or Prev Week, the Start Date/Start Time fields are inactive,
and when the Stop Date/Stop Time fields are blank, they are populated with the current date and time.
When you modify the stop date/time, the modified value is used for the plot duration. When you select
TOD, both Start Date/Start Time and Stop Date/End Time fields are activated, and the Stop
Date/End Time fields are populated with the current date and time.
Start Date/Start Time
Specify the start date and time for the graph in this field.
Stop Date/End Time
Specify the stop date and time for the graph in this field.