


9-10
Cisco WAN Manager User’s Guide
Version 10.5, Part Number 78-12945-01 Rev. D0, August 2003
Chapter 9 Summary Report and Wingz Report
Configuring Summary Reports
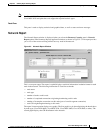
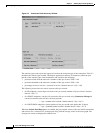
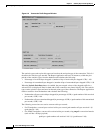
Figure 9-5 Connection Traffic Summary Window
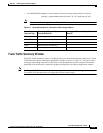
The statistic types used to plot this report are based on the end-point type of the connection. Table 9-3
describes the statistic types needed. The Report Application retrieves all instances (within the plot
period) of the statistic types from the database and calculates the following:
• percent received from the network = (number of bits per second / CIR) * 100
• percent transmitted to the network = (number of bits per second / CIR) * 100
• percentage of time in service = (seconds in service / (bucket interval * 60)) * 100
The following conversions are used to convert to bits per second:
• for FR endpoints, convert bytes received to bits per second (number of bytes received / (bucket
interval * 60)) * 8
• for ATM/CE endpoints, convert cells received to bits per second, using Connection Manager’s
conversion formula (each cell has a 48 byte payload)
— bps = (number cells received / (bucket interval * 60)) * 48 * 8
• for VOICE/DATA endpoints, convert packets to bits per second (each packet has 24 bytes)
— bps = ((number packets received / (bucket interval * 60)) * 24 * 8
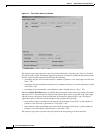
When the Include Peak Data button is enabled, the percent peak values of the total traffic transmitted
and received for a selected PVC are displayed along with the average values in the same graph. The
average raw counts are displayed in tabular form.