


9-16
Cisco WAN Manager User’s Guide
Version 10.5, Part Number 78-12945-01 Rev. D0, August 2003
Chapter 9 Summary Report and Wingz Report
Configuring Summary Reports
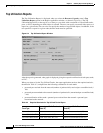
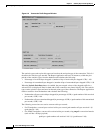
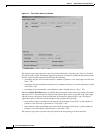
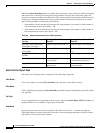
Figure 9-7 Trunk Traffic Summary Window
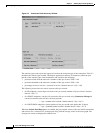
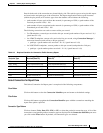
The statistic types used to plot this report are based on the trunk’s end-point type. Table 9-5 describes
the statistic types needed. The Report Application retrieves all instances (within the plot period) of the
statistics types from the database and calculates the following:
• percentage of bytes received from network = (number of packets or cells received per second / line
load) * 100
• percentage of bytes transmitted to the network = (number of packets or cells transmitted per second
/ line load) * 100
• percentage of time unavailable = (unavailable seconds / (bucket interval * 60)) * 100
When the Include Peak Data button is enabled, the percent peak values of the total traffic transmitted
and received for a selected trunk are displayed. The percent peak values are plotted in the same graph
with the percent average data. Data for both ends of the trunk are plotted side by side. The Report
Application retrieves statistics from the database and calculates the following:
• peak number of bytes received from the network (in percentage of line load) = ((peak number of
packets or cells received) / (peak interval * line load)) * 100
• peak number of bytes transmitted to the network (in percentage of line load) = ((peak number of
packets or cells transmitted) / (peak interval * line load)) * 100
The statistic types used to plot this report are based on the end-point type of the connection.