


9-19
Cisco WAN Manager User’s Guide
Version 10.5, Part Number 78-12945-01 Rev. D0, August 2003
Chapter 9 Summary Report and Wingz Report
Configuring Summary Reports
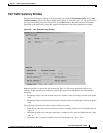
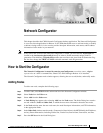
Port Traffic Summary Window
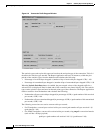
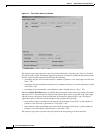
The Port Traffic Summary window is displayed when you select the Performance Data menu’s Port
Traffic Summary option in the Report Application window, as shown in Figure 9-8. You must select a
port type and plotting time interval, then click on the Plot button to have the statistical information
pertaining to the port traffic, plotted into graphs and displayed in the Report Application window.
Figure 9-8 Port Traffic Summary Window
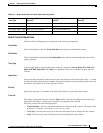
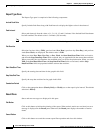
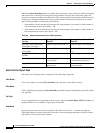
Required statistics for port traffic are described in Table 9-6. The report application retrieves all
instances of the statistics types within the selected plot period from the database and calculates the
following:
• Percentage of bytes received from the network = (number of bits received per second / port speed)
* 100
• Percentage of bytes transmitted to the network = (number of bits transmitted per second / port speed)
* 100
The following conversions are used to convert to bits per second:
• Frame Relay ports bytes received to bits per second = (number of bytes received / (bucket interval
* 60)) * 8
• ATM ports convert cells to bits per second: bps = (number of cells received / (bucket interval * 60))
* 48 * 8
• Voice ports: bps = ((number of packets received / (bucket interval * 60)) * 24 *8